Business Statistics
Business Transition Matrix (%)
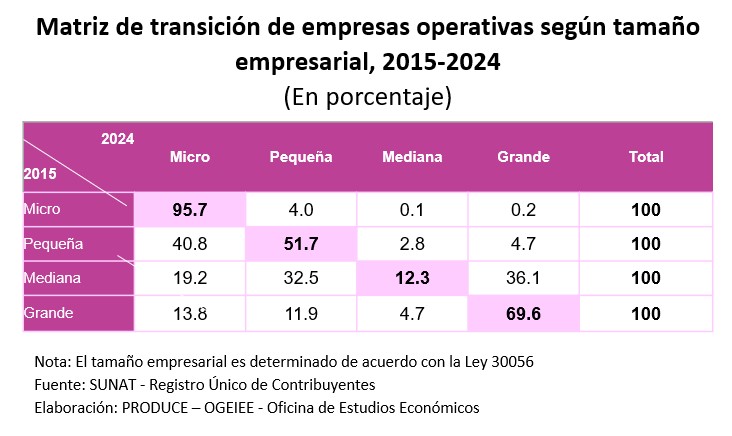
A business transition matrix is an analytical tool used to assess how businesses evolve over time based on their size. The matrix shows, in percentage terms, how businesses in a given category in an initial year are distributed across different categories in a subsequent year. This helps identify business dynamics and growth patterns, providing key insights for the design of public policies and business strategies.
For the 2015–2024 period, the results show significant progress in business mobility, particularly among medium-sized and large enterprises. For example, 36.1% of businesses classified as medium-sized in 2015 had moved into the large-enterprise category by 2024, reflecting sustained and significant growth. Large enterprises also show notable stability, with two out of every three maintaining their classification. It is also worth noting that 7.5% of small businesses managed to move up to higher categories, including those that became medium-sized or large enterprises, demonstrating successful growth cases within this segment. These results show that, despite existing challenges, many businesses find opportunities to grow and establish themselves in higher categories, contributing to the strengthening of the country’s business landscape.
Years of Operation of Formal MSEs
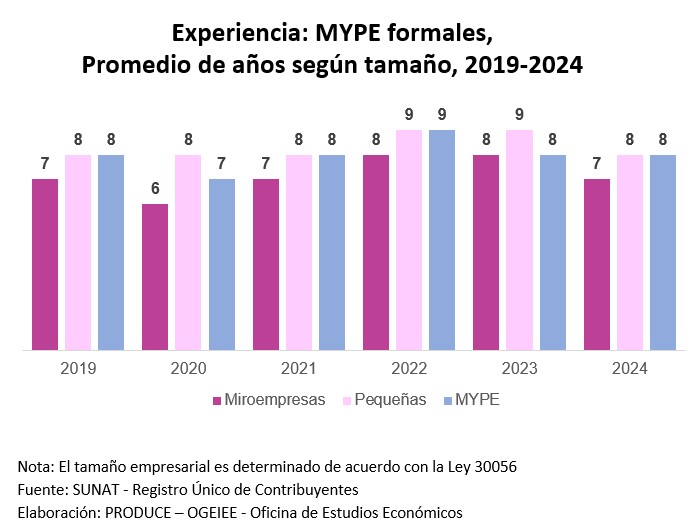
The chart shows the average number of years that MSEs have been operating over a given period. It helps to analyze the stability, experience, and longevity of businesses in the formal market.
Between 2019 and 2024, formal MSEs had an average of 8 years of operation, showing a fairly stable trend over this period. Small enterprises, in particular, recorded an average of 8 years, lower than the figure reported in 2023 (9 years).
Survival Rate of Formal MSMEs
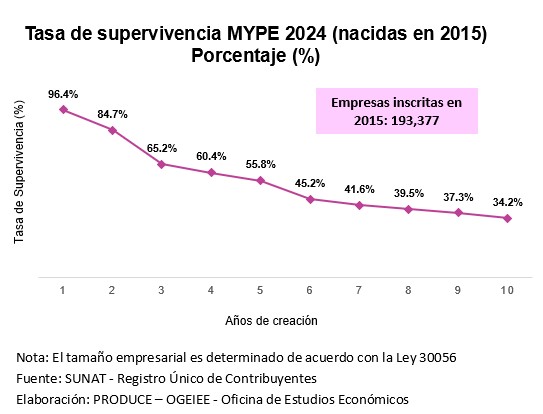
The chart shows the survival rate of MSEs, calculated by comparing the number of MSEs created in a base year with the number of MSEs still operating in subsequent years. It helps measure the resilience of MSEs in the face of economic challenges.
The survival rate of the MSE cohort analyzed was 96.4% in its year of creation (2015). After the first year, 84.7% of enterprises remained in the market, and by the third year, the survival rate had reached 65.2%. After ten years, 34.2% of the MSEs created in 2015 were still operating.
*For the purposes of this analysis, operational businesses include those classified as active, under provisional inactive status, or under temporary suspension.
Entry Rate of Formal MSMEs
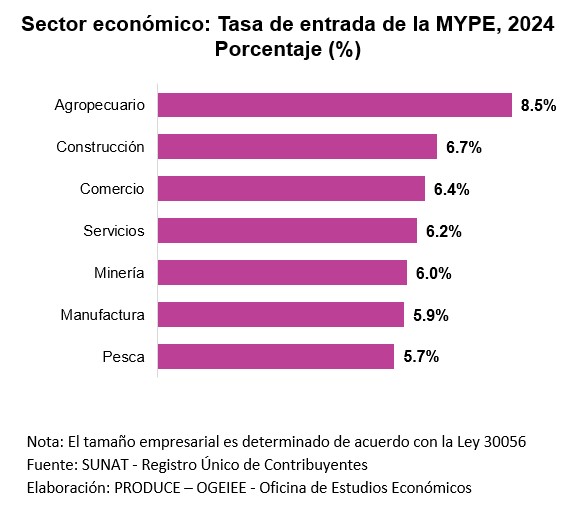
The chart presents the Gross Entry Rate (GER), which measures the percentage of enterprises created in a given year relative to the total number of enterprises operating in that same year.
The agriculture and livestock sector recorded the highest GER, at 8.5%, followed by construction (6.7%) and trade (6.2%), while the fishing sector registered the lowest rate, at 5.7%.