Compartir en:
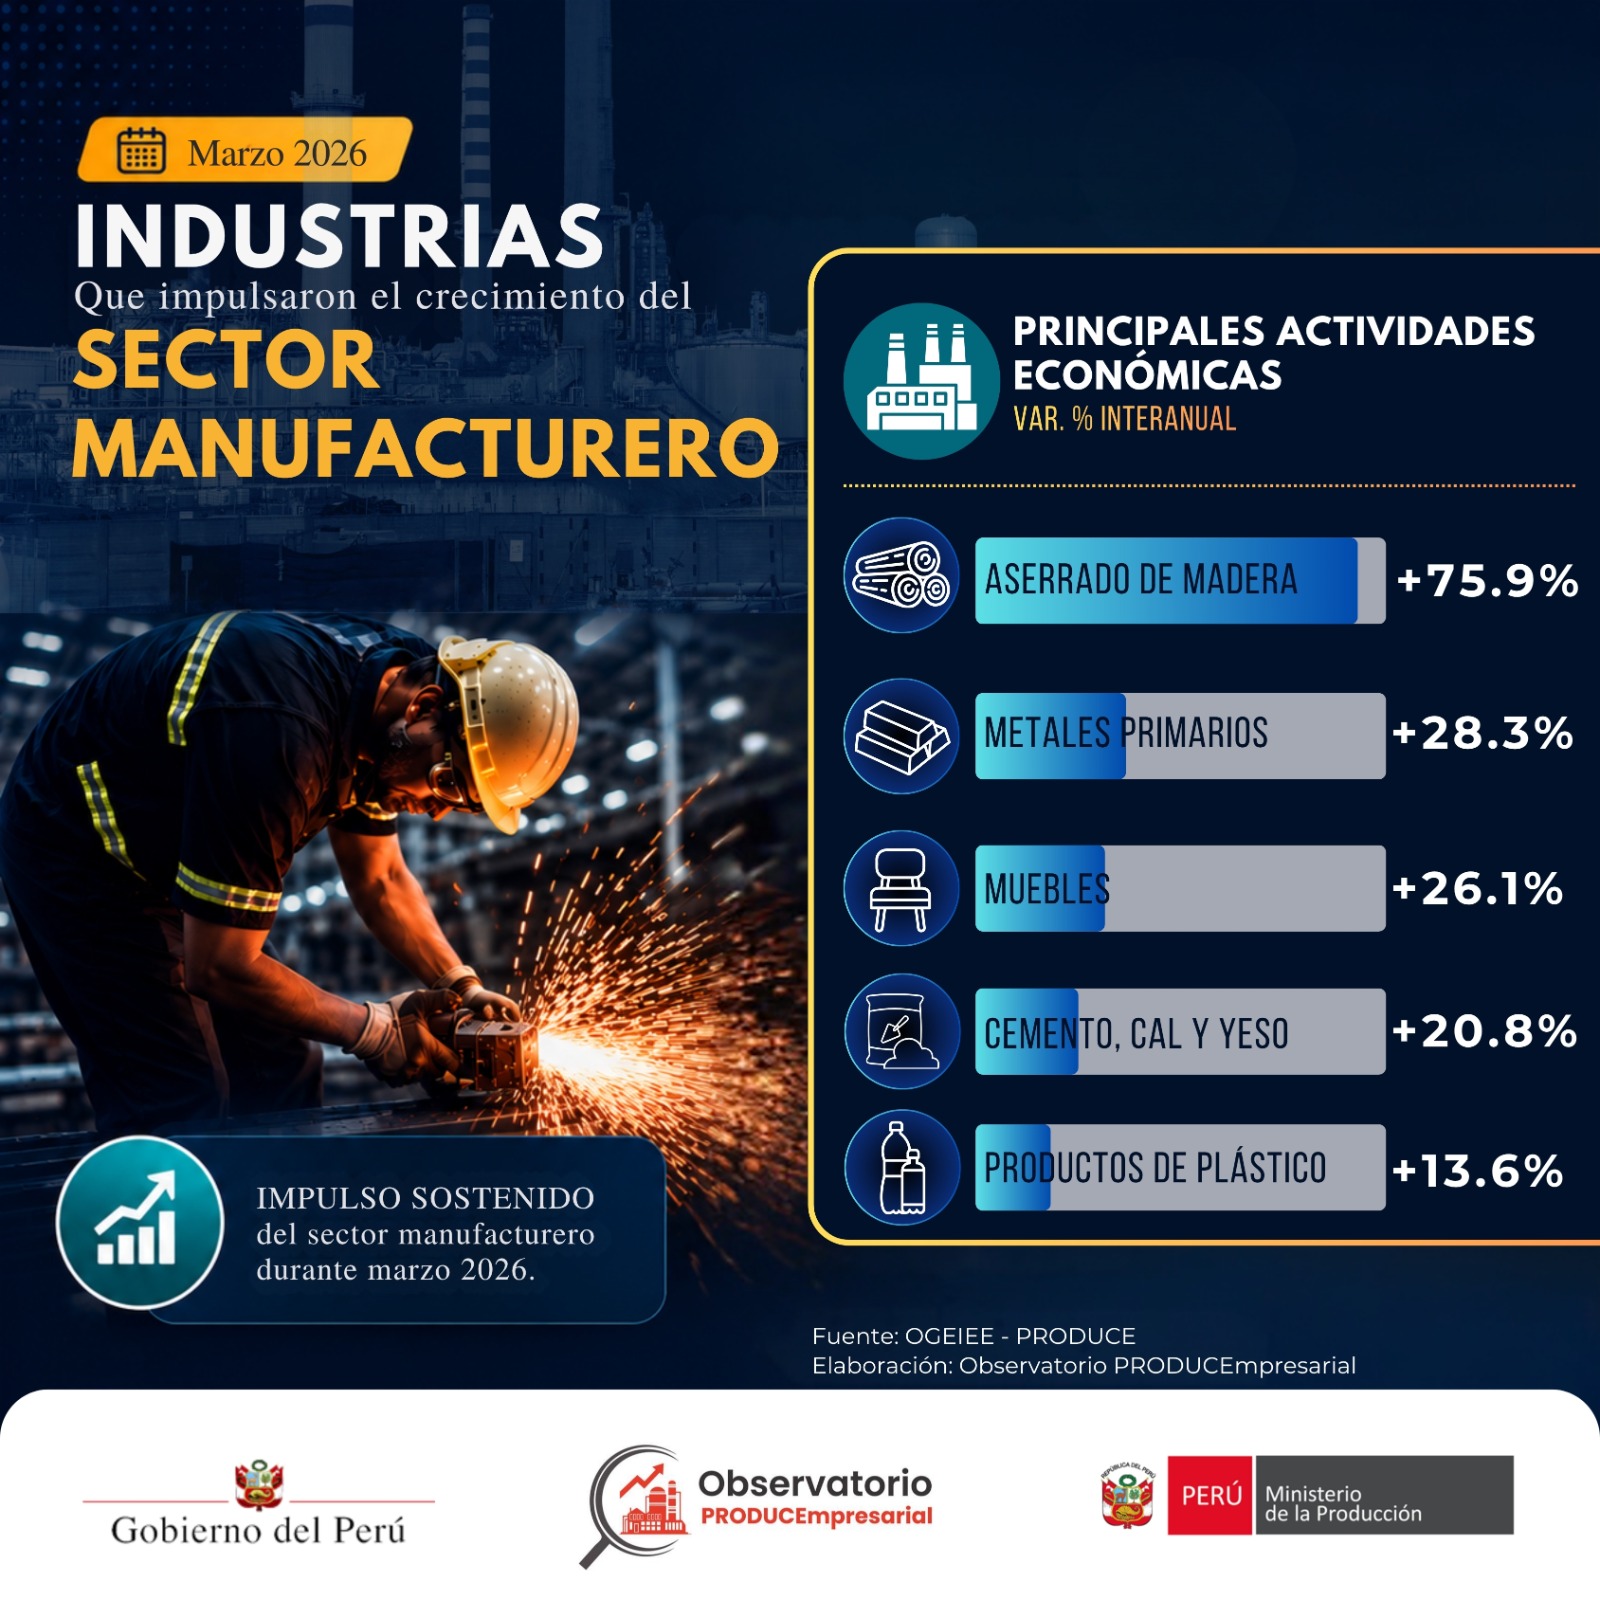
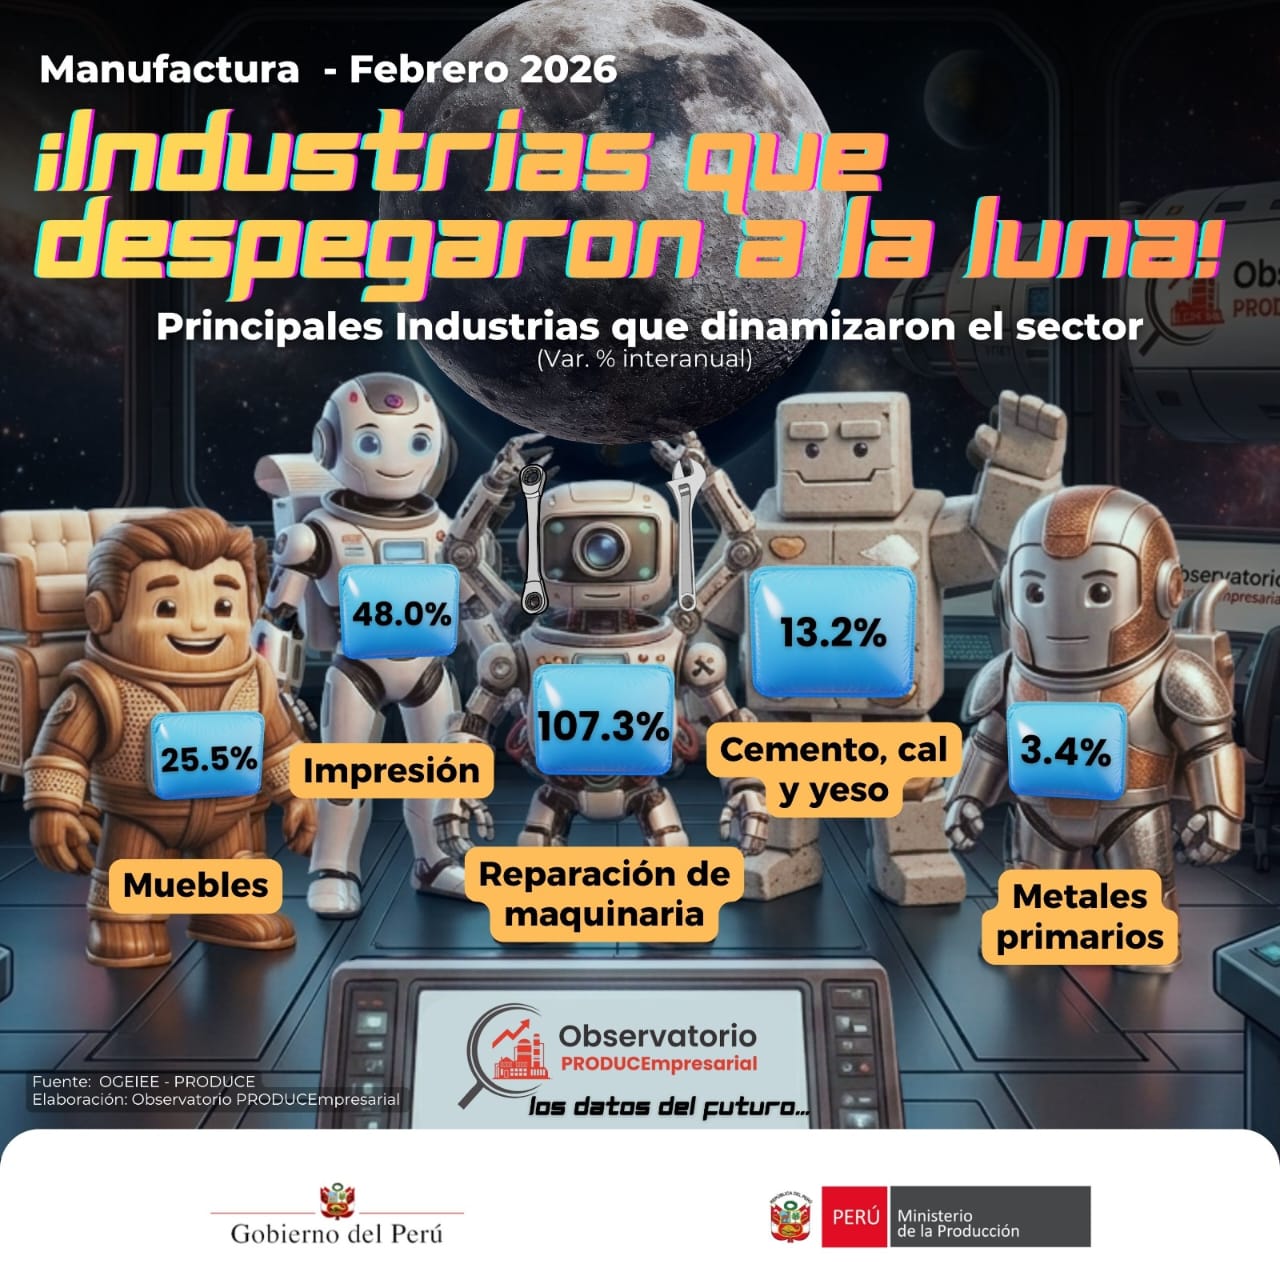
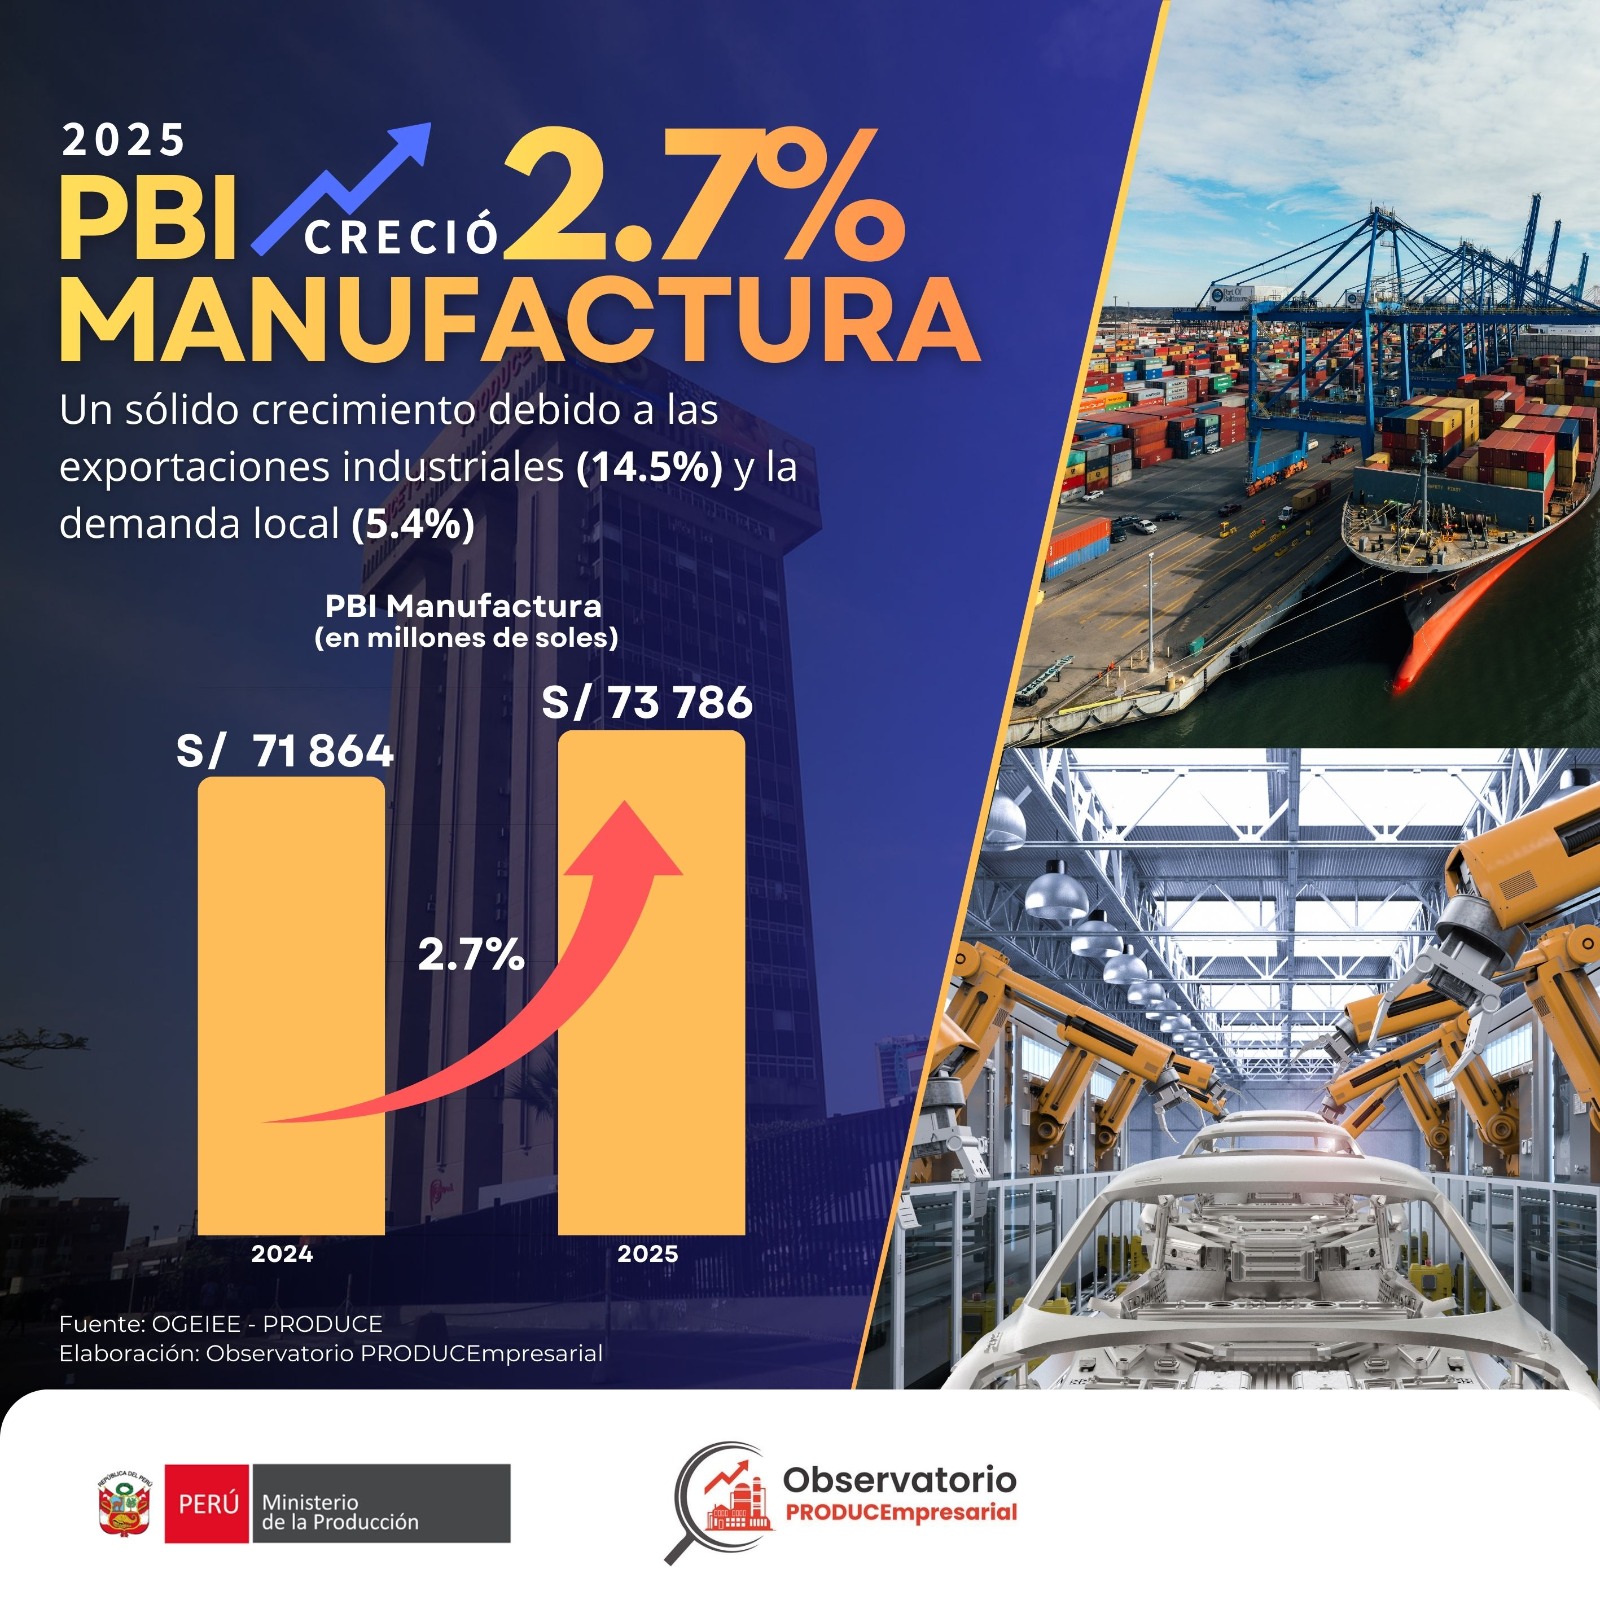
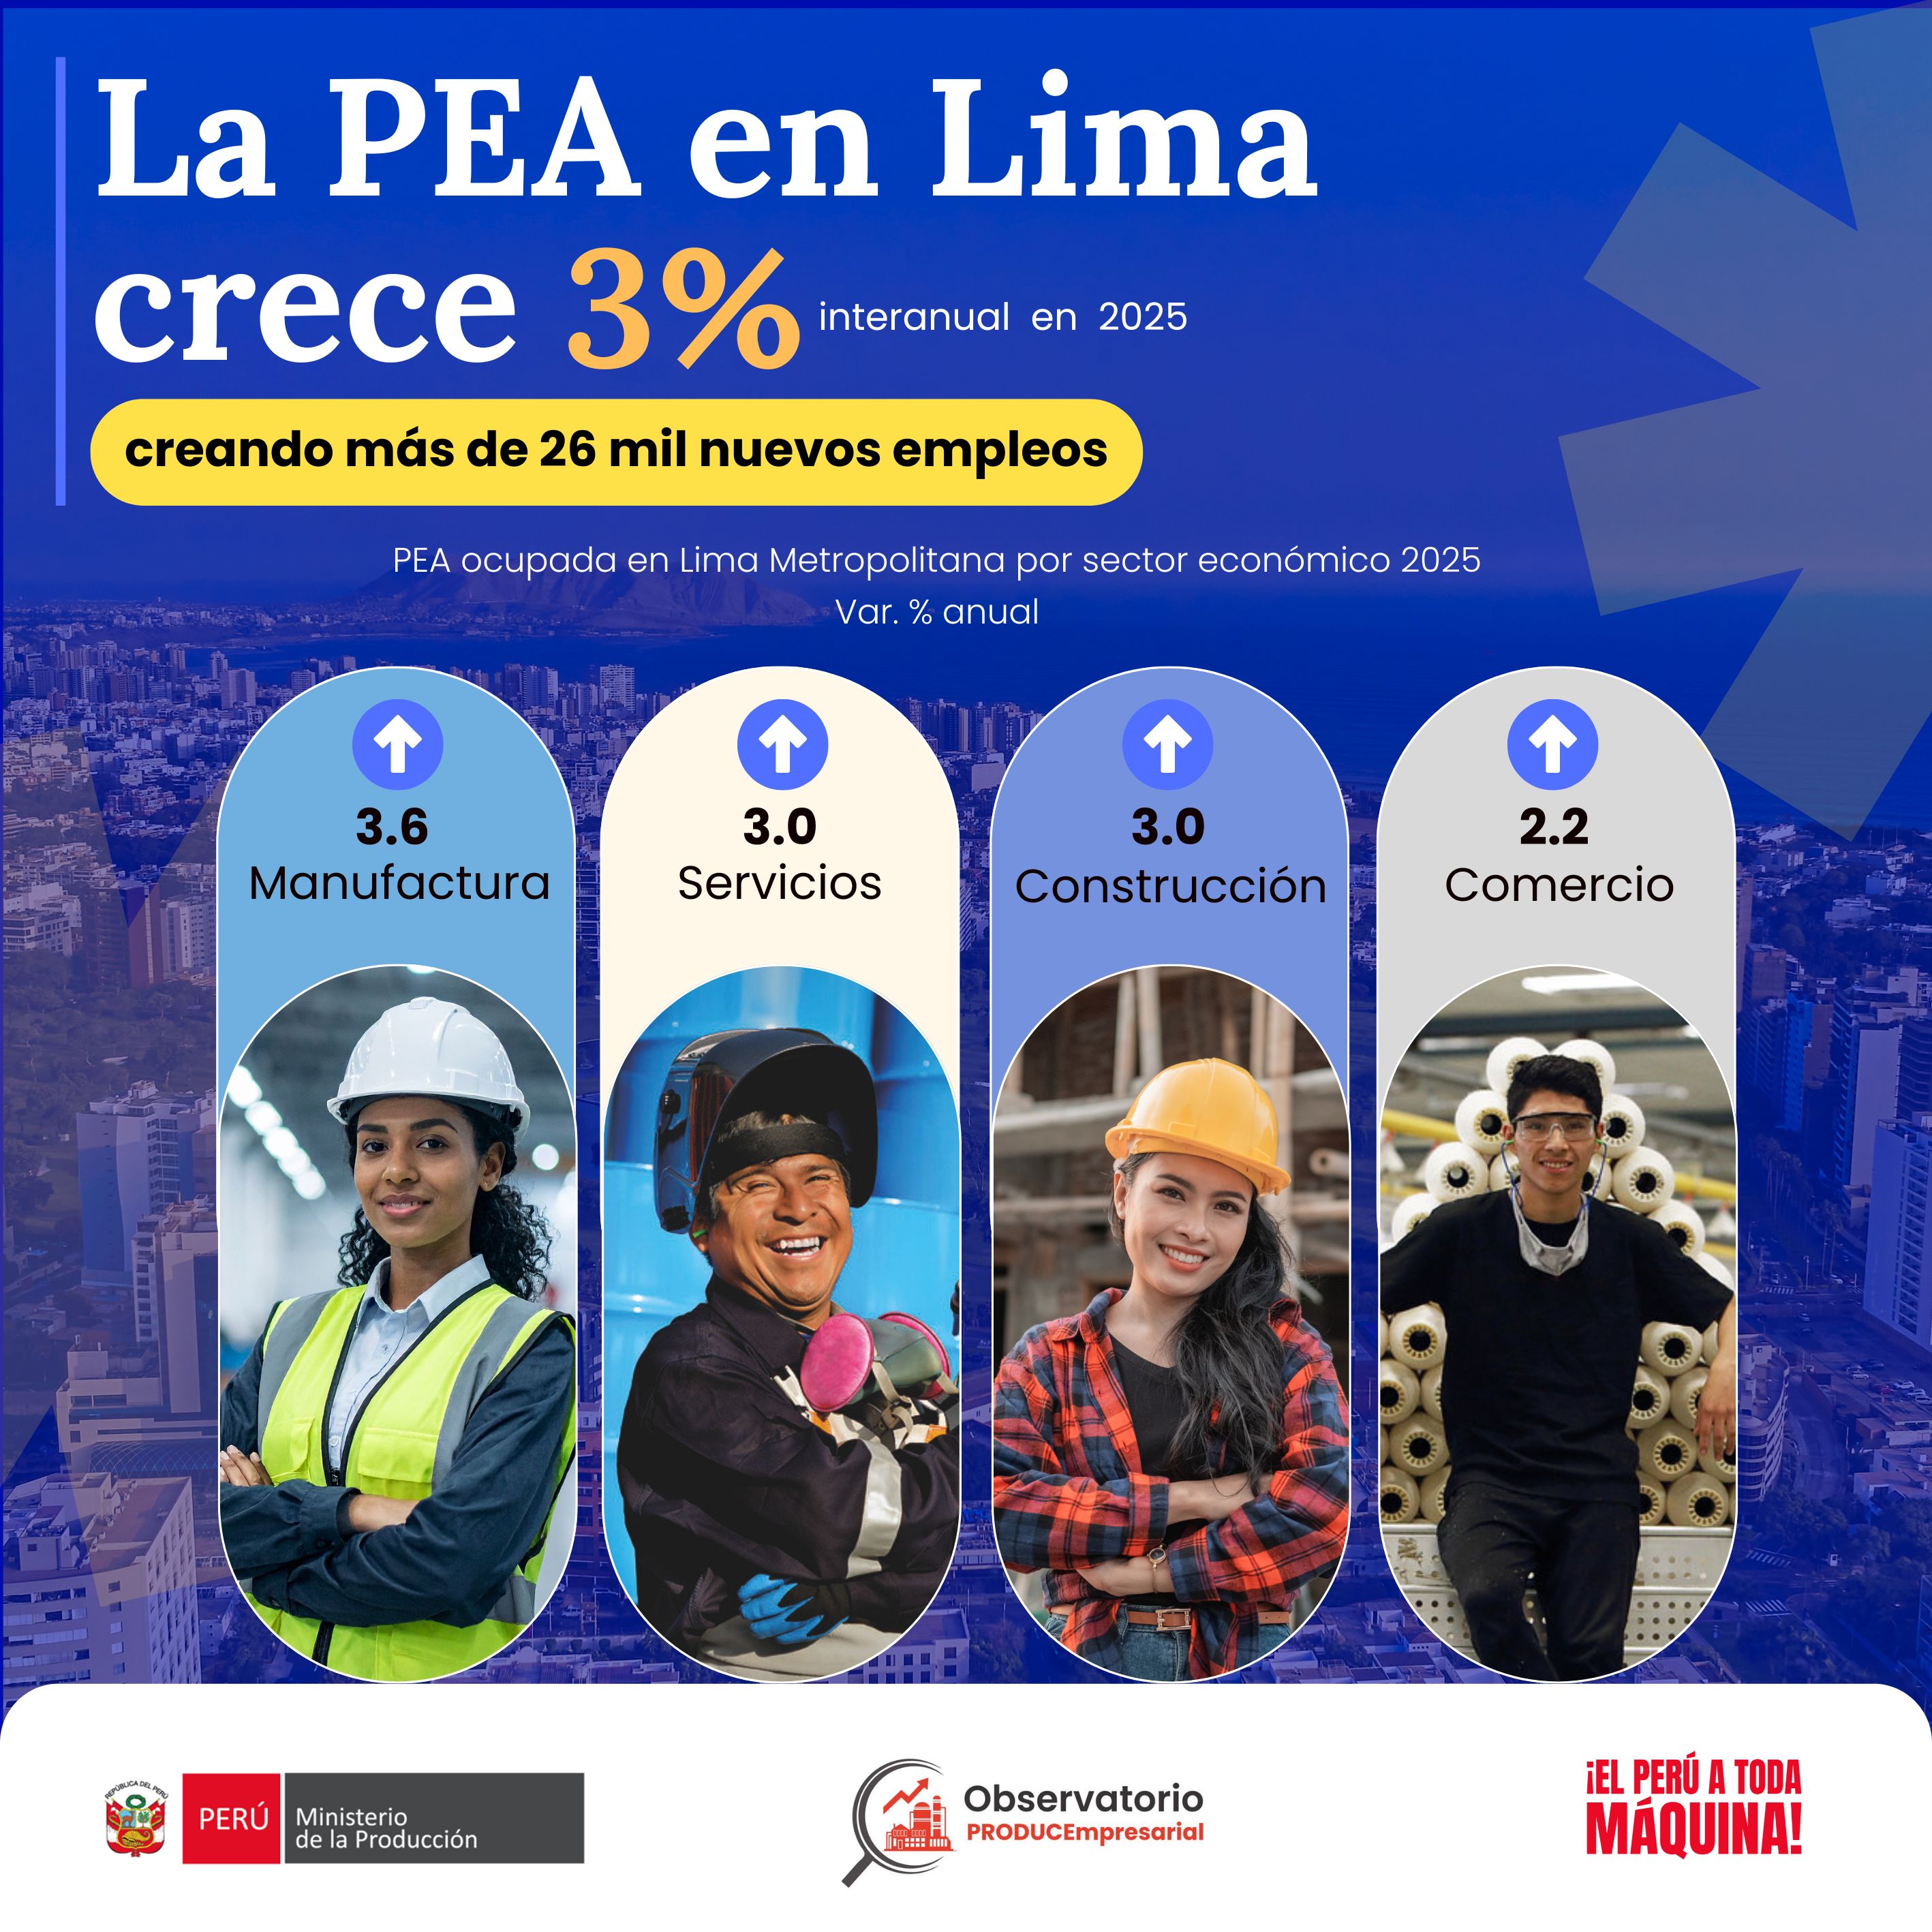
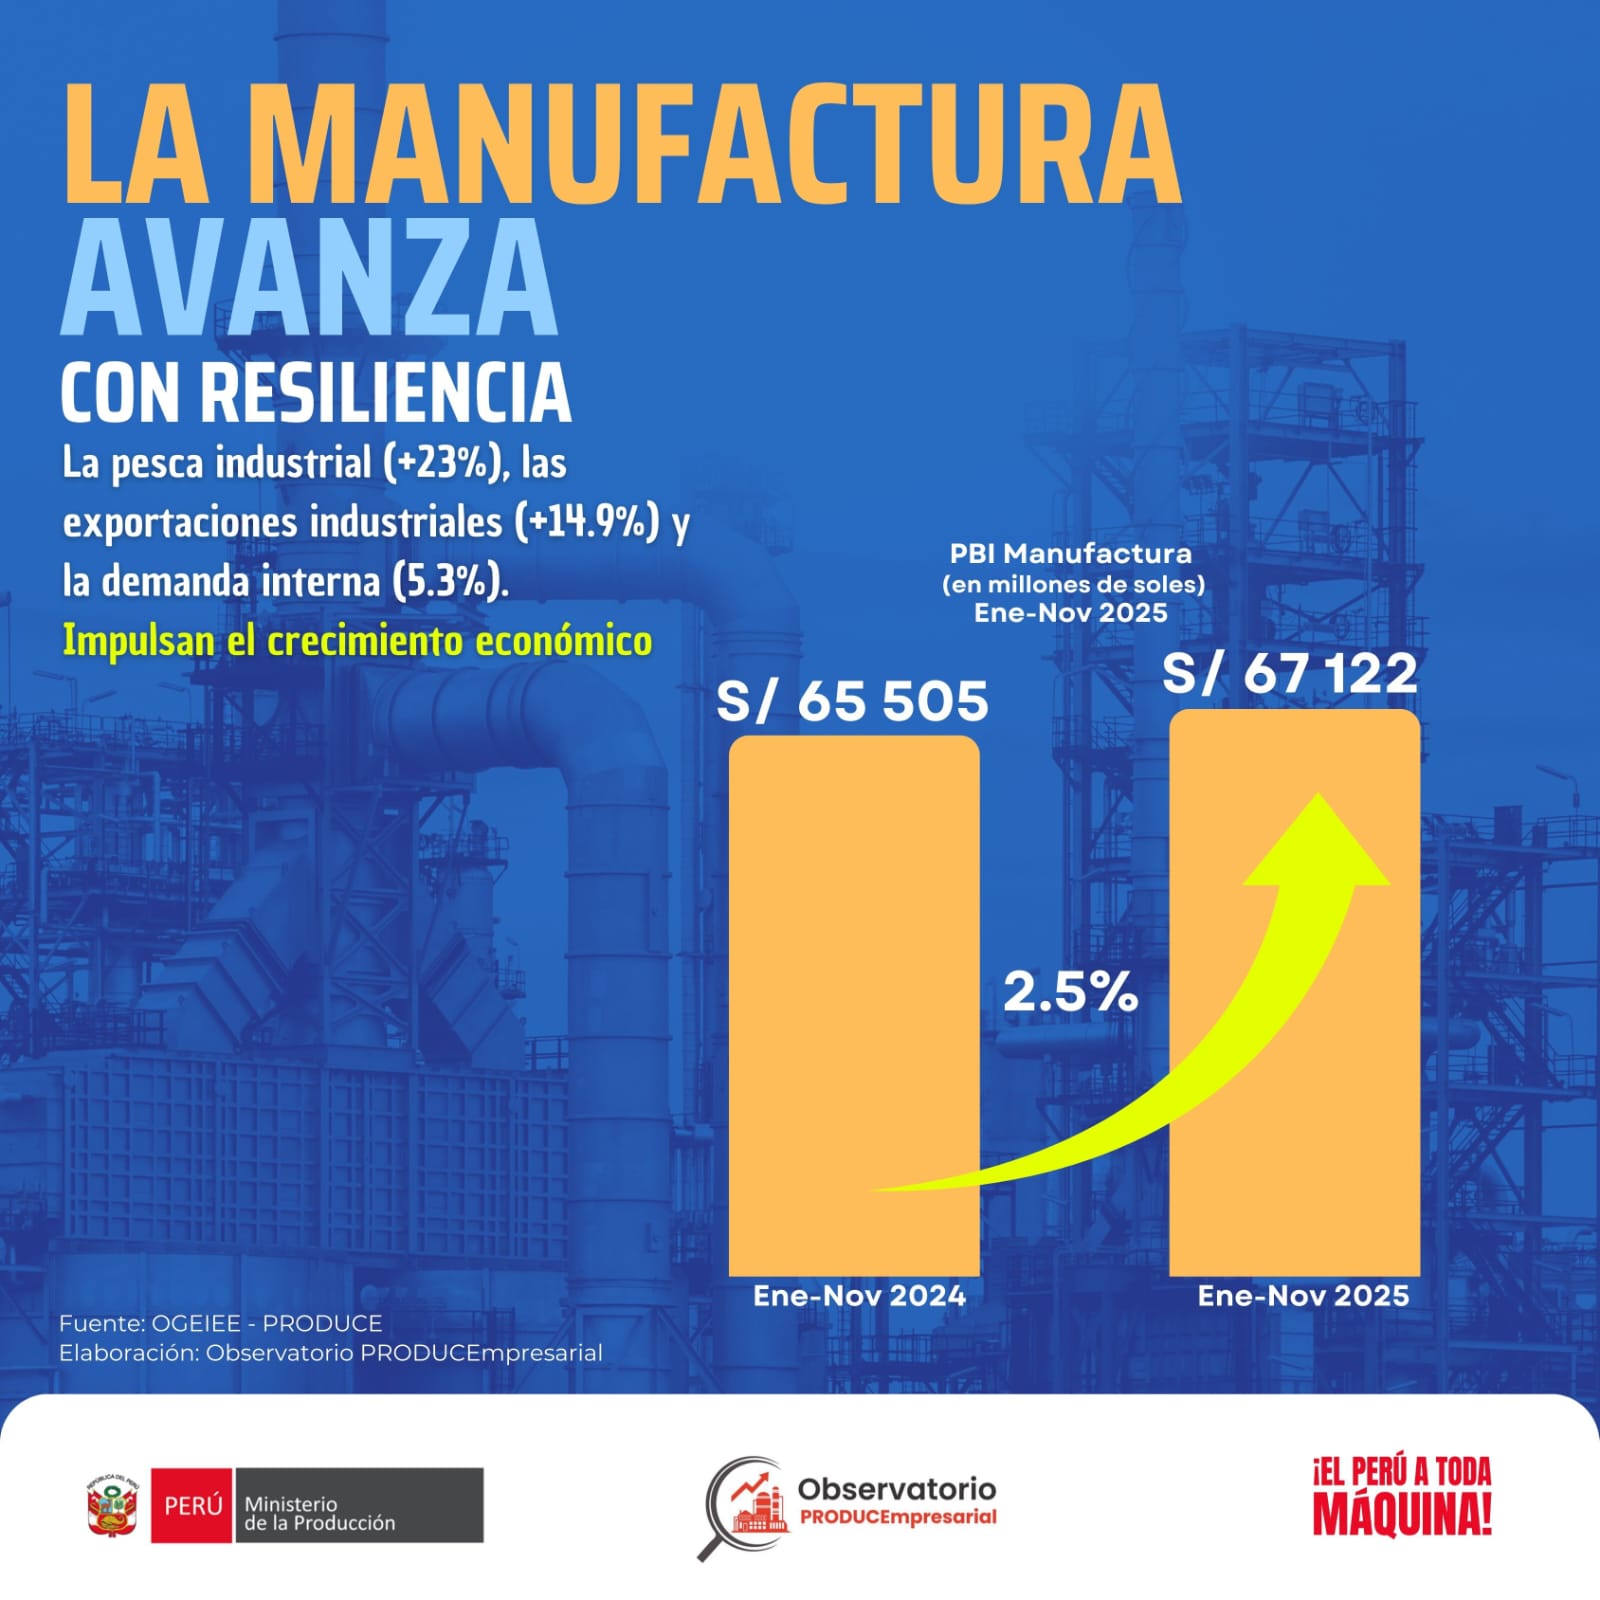
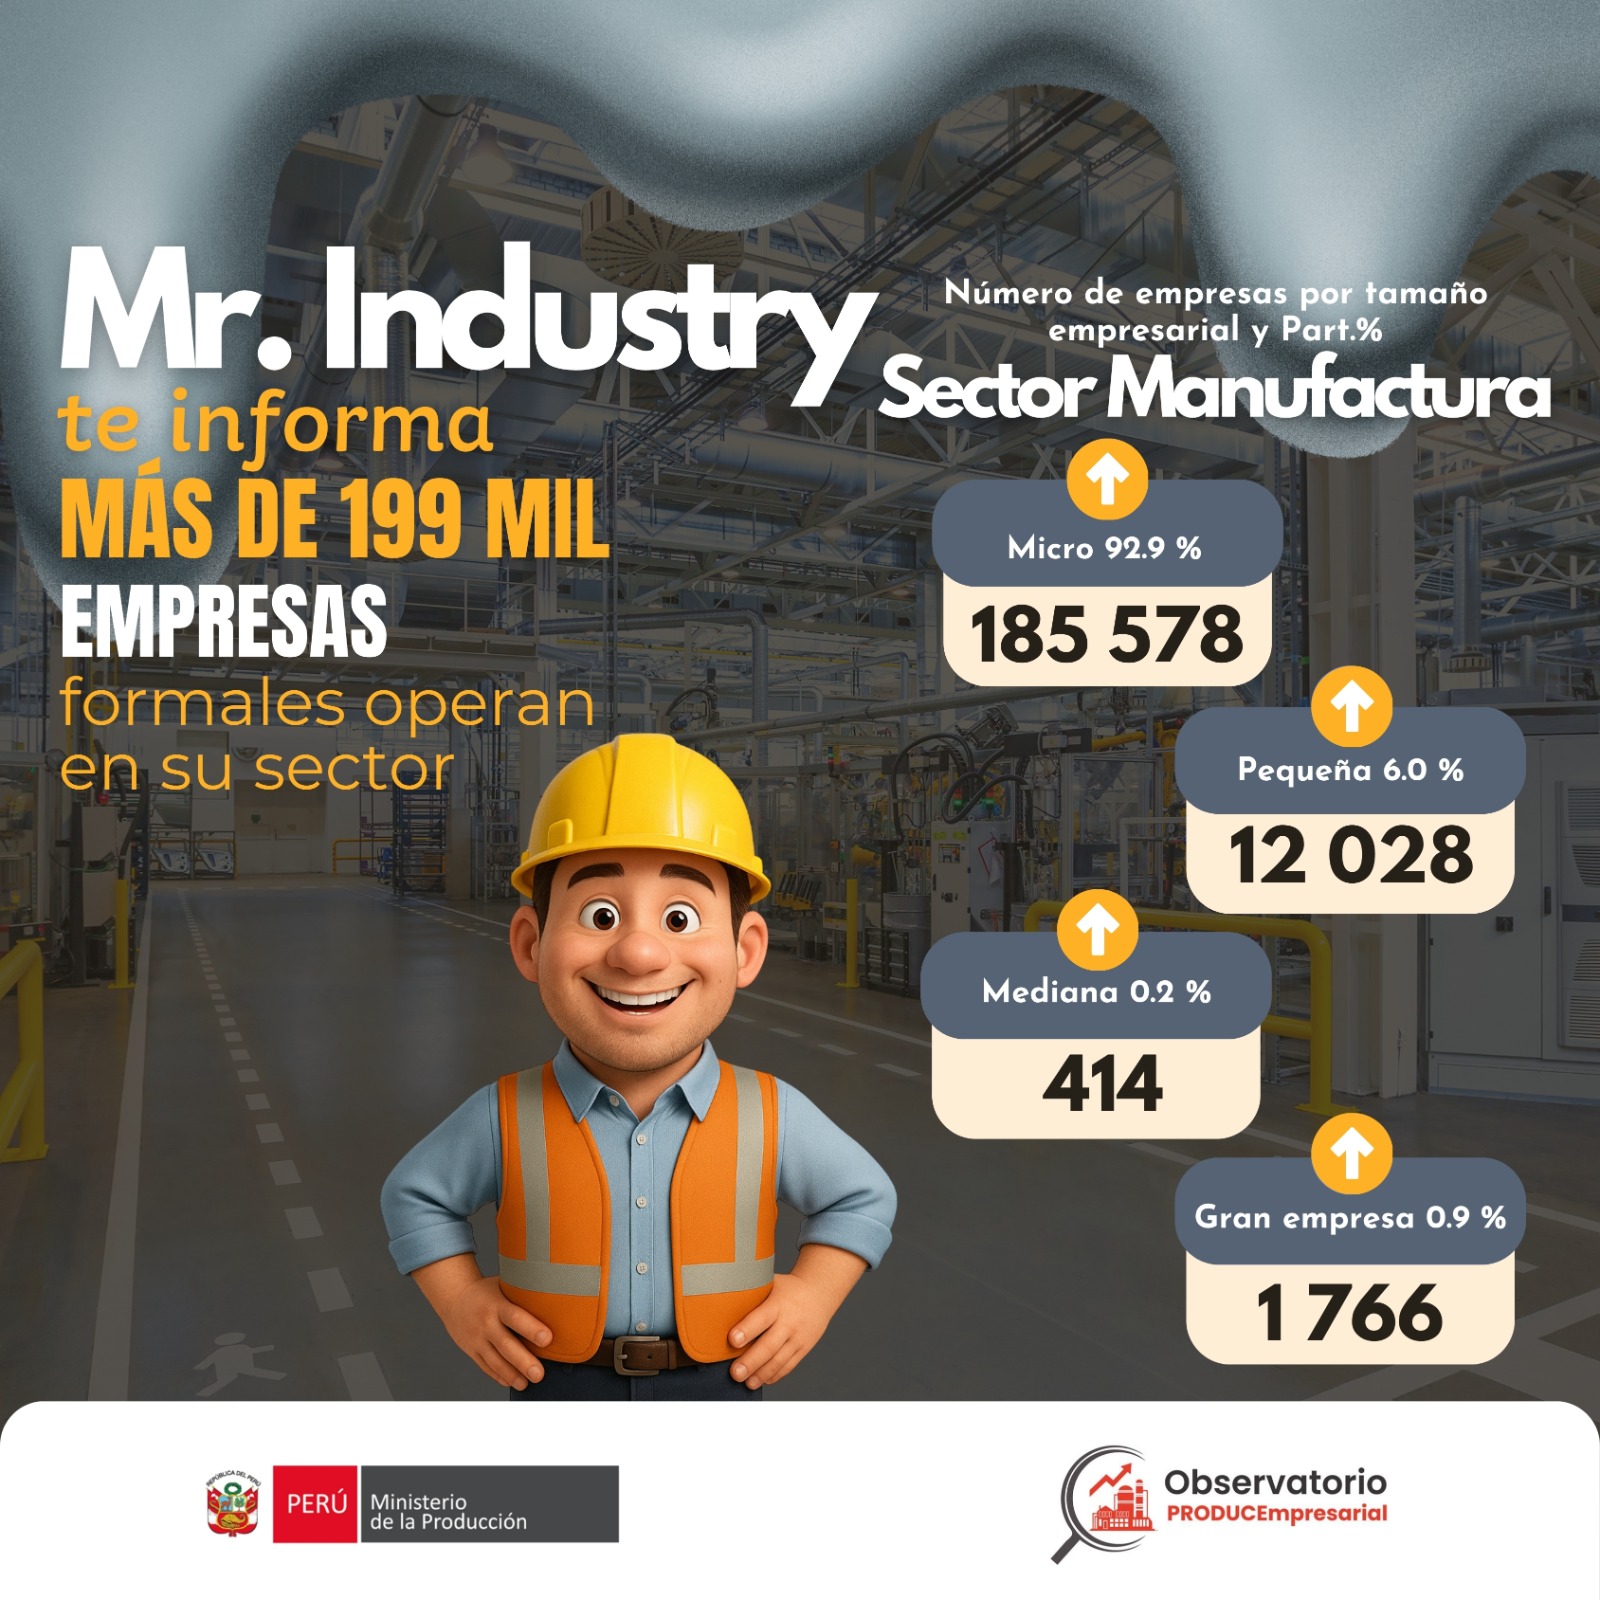
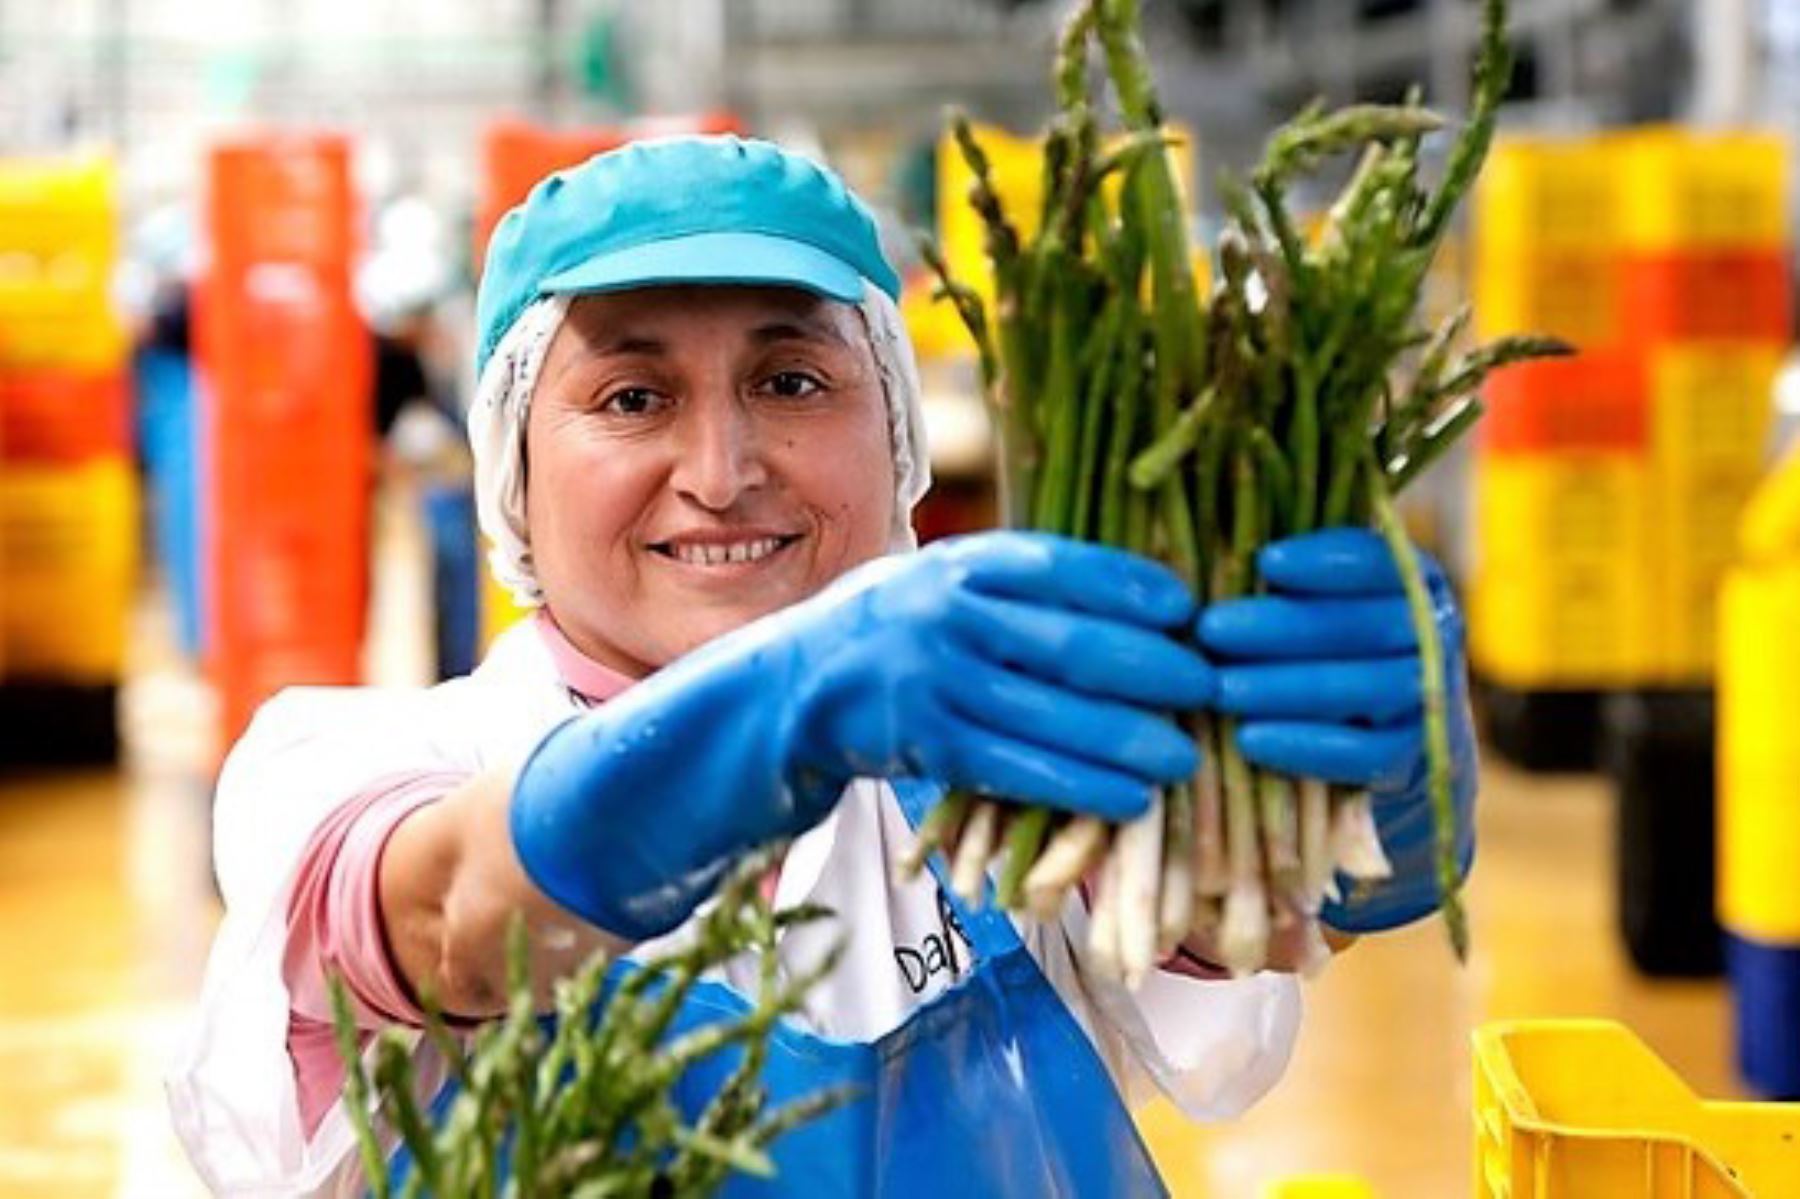
Manufacture
febrero 2026
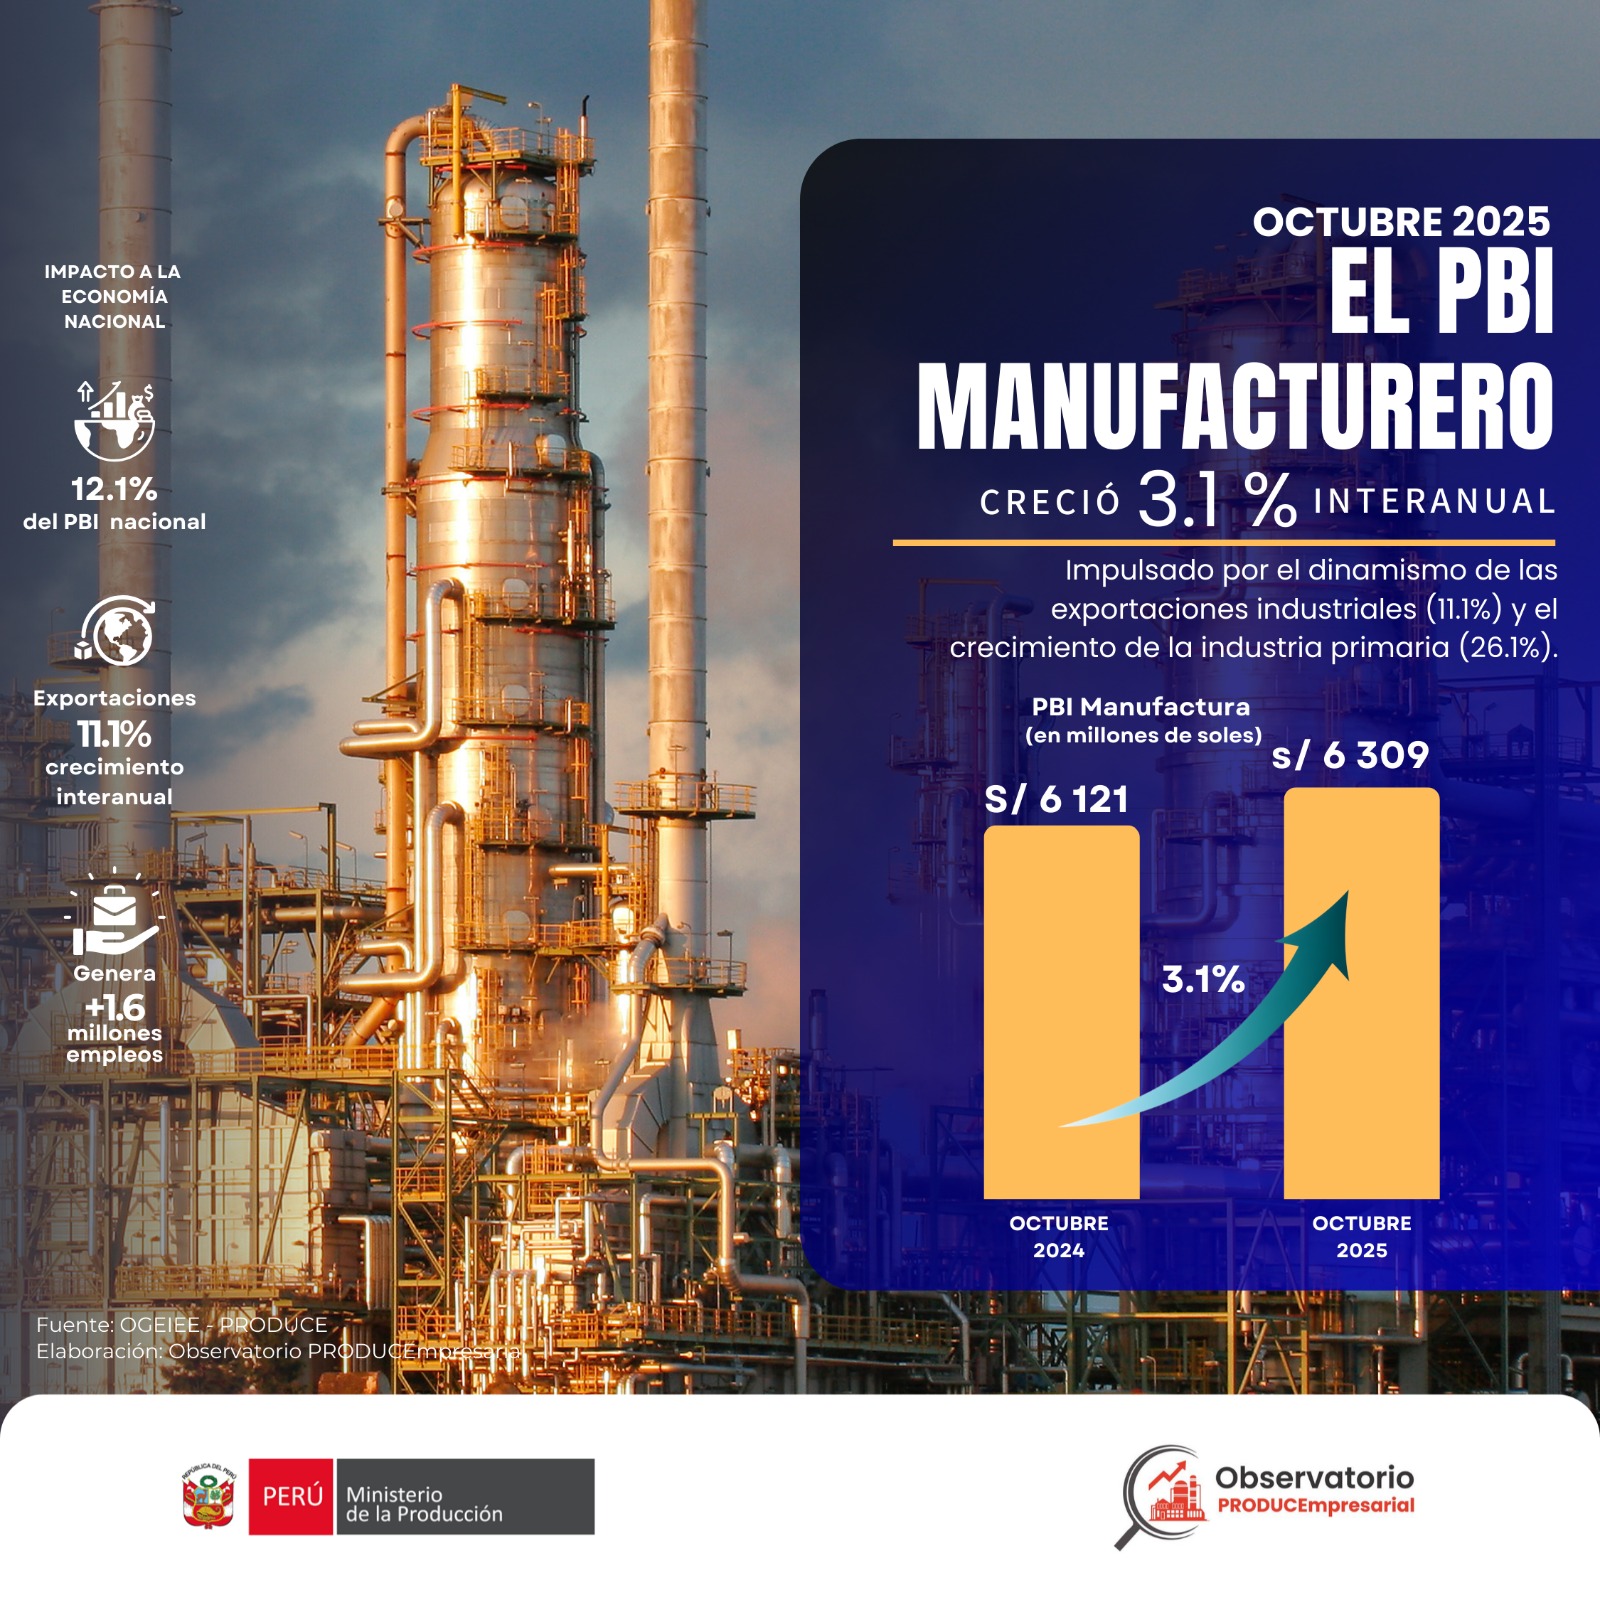
In February 2026, manufacturing GDP recorded slight growth of 2.7% compared with February 2025. This performance was mainly driven by the moderate growth observed in non-primary manufacturing (3.6%); likewise, slight growth in primary manufacturing (+0.3%) also contributed.
01
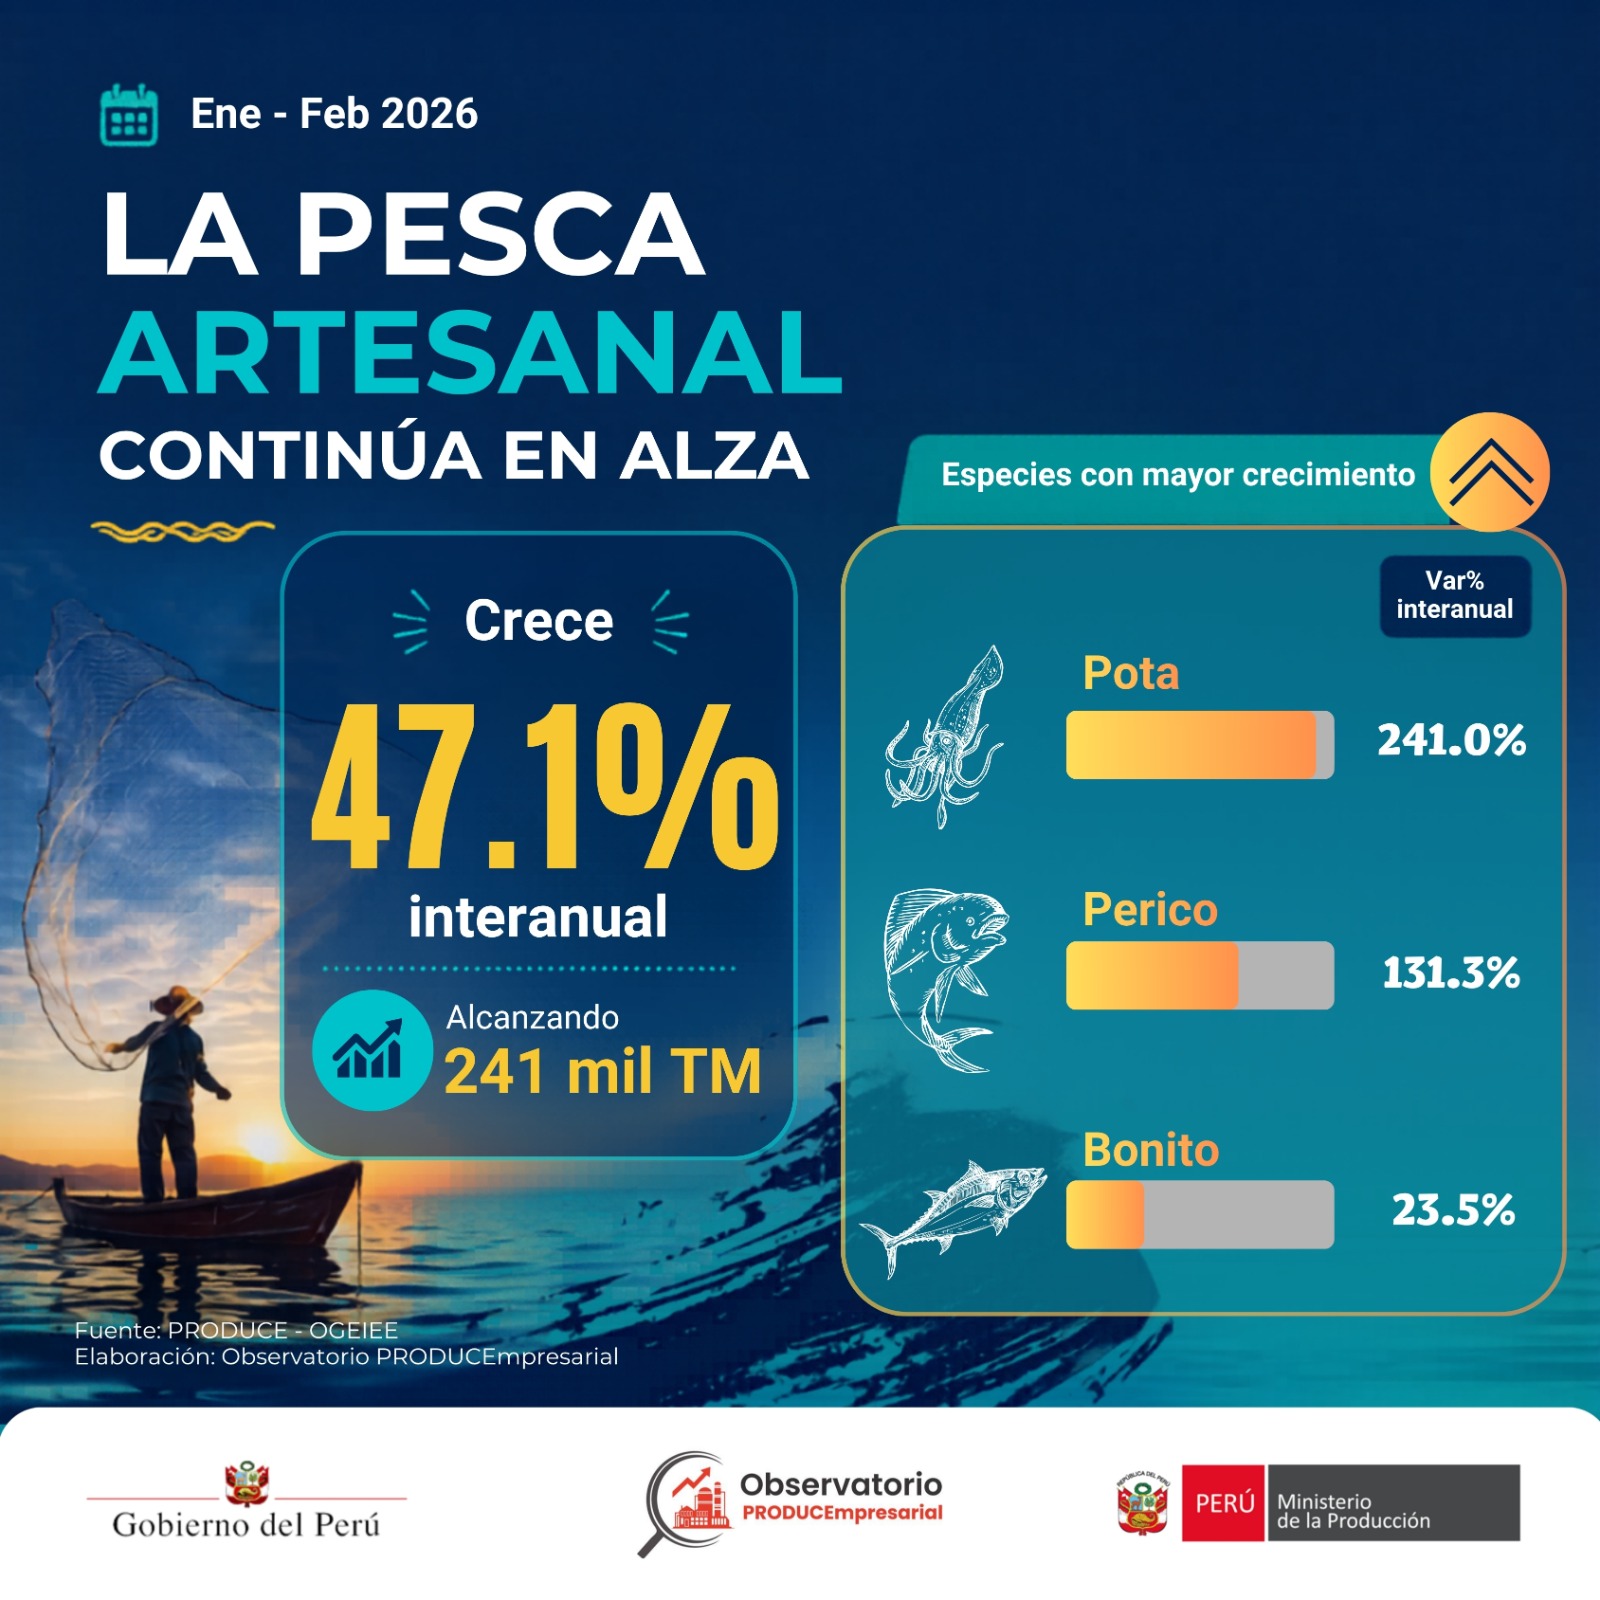
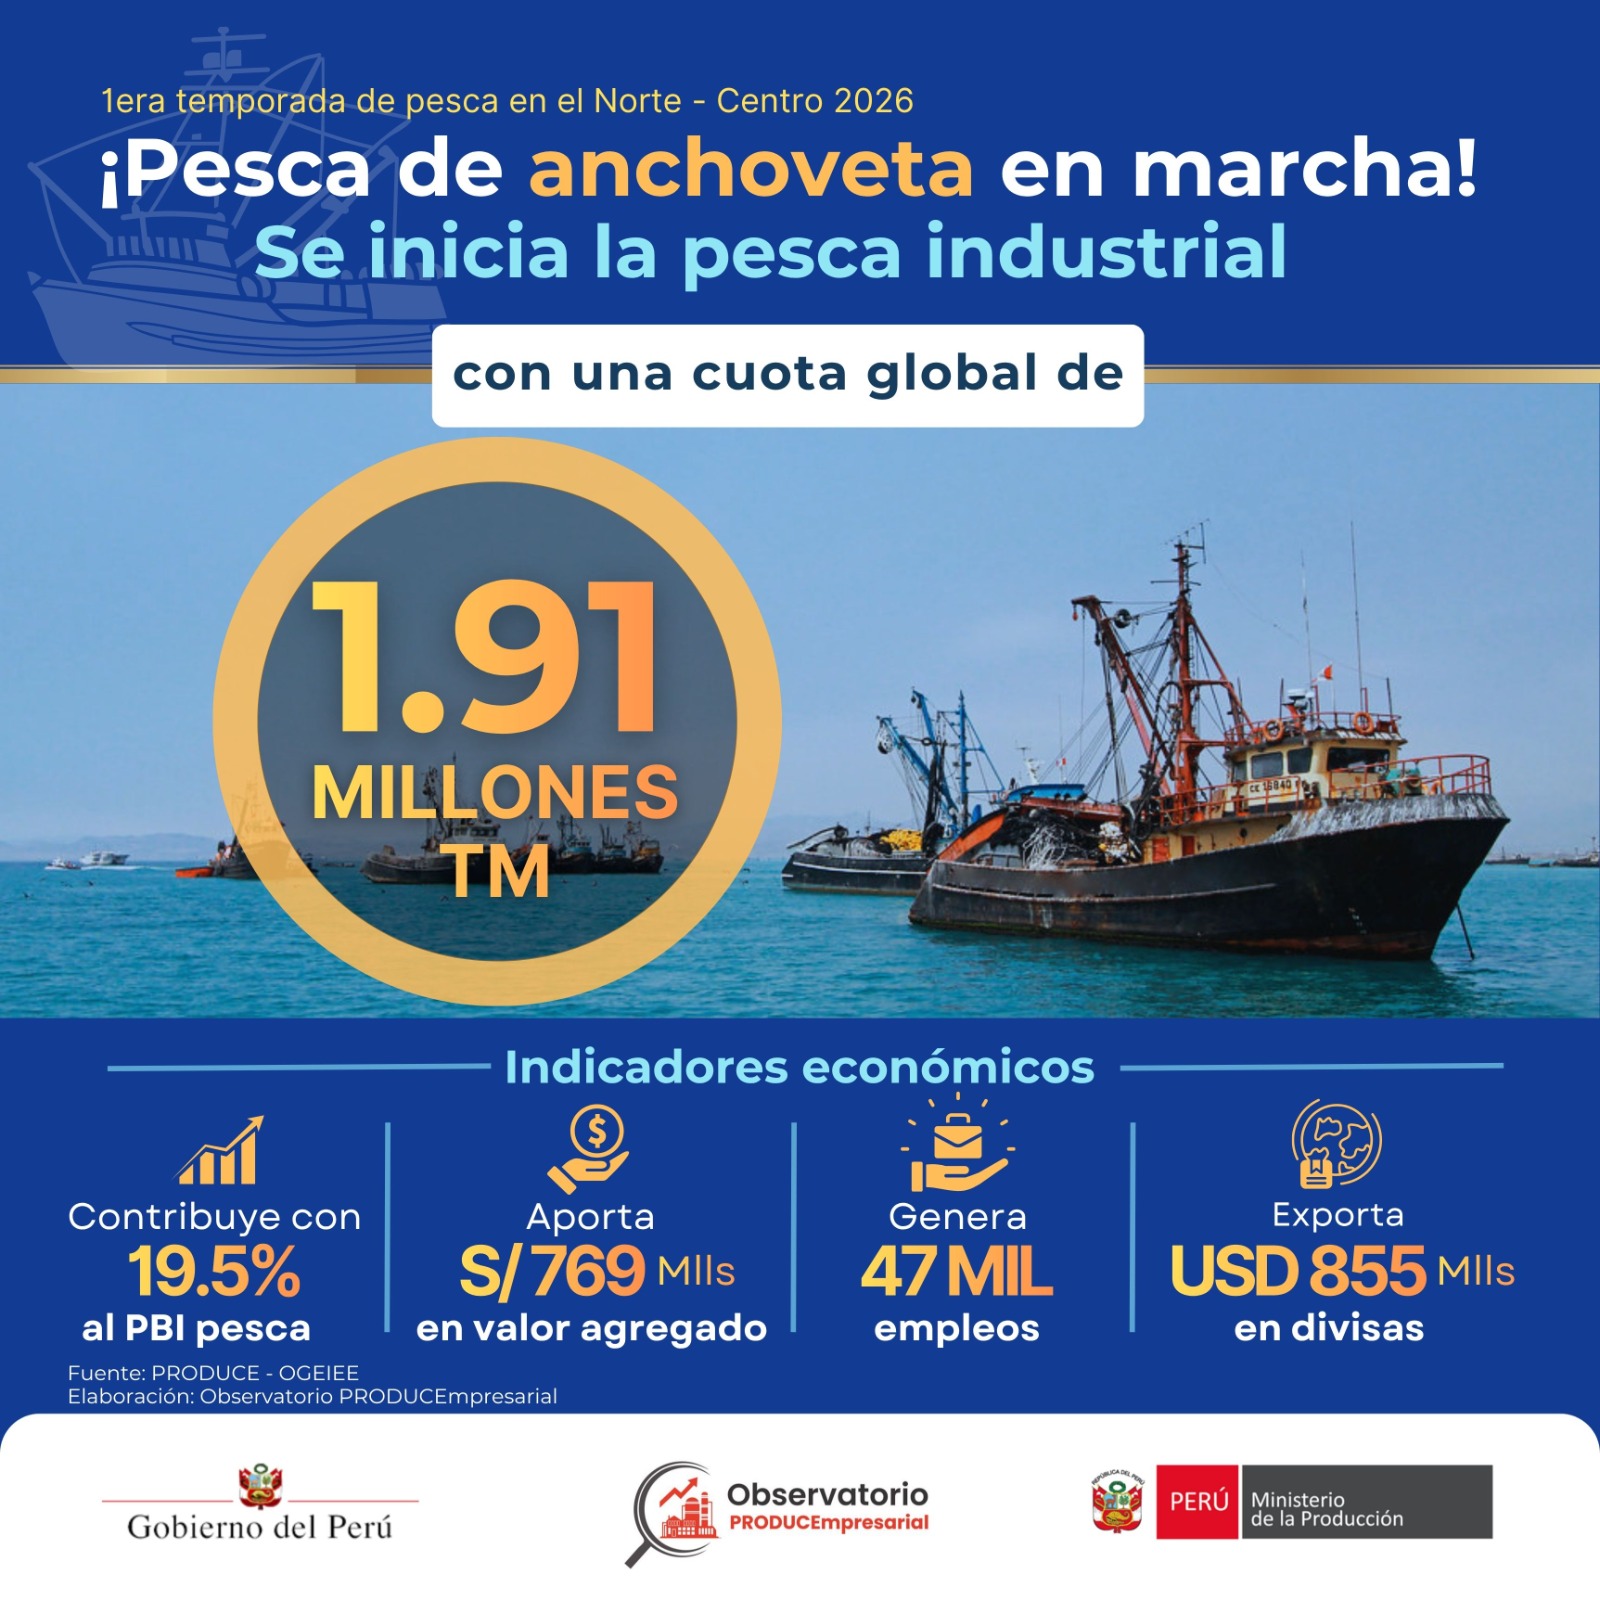
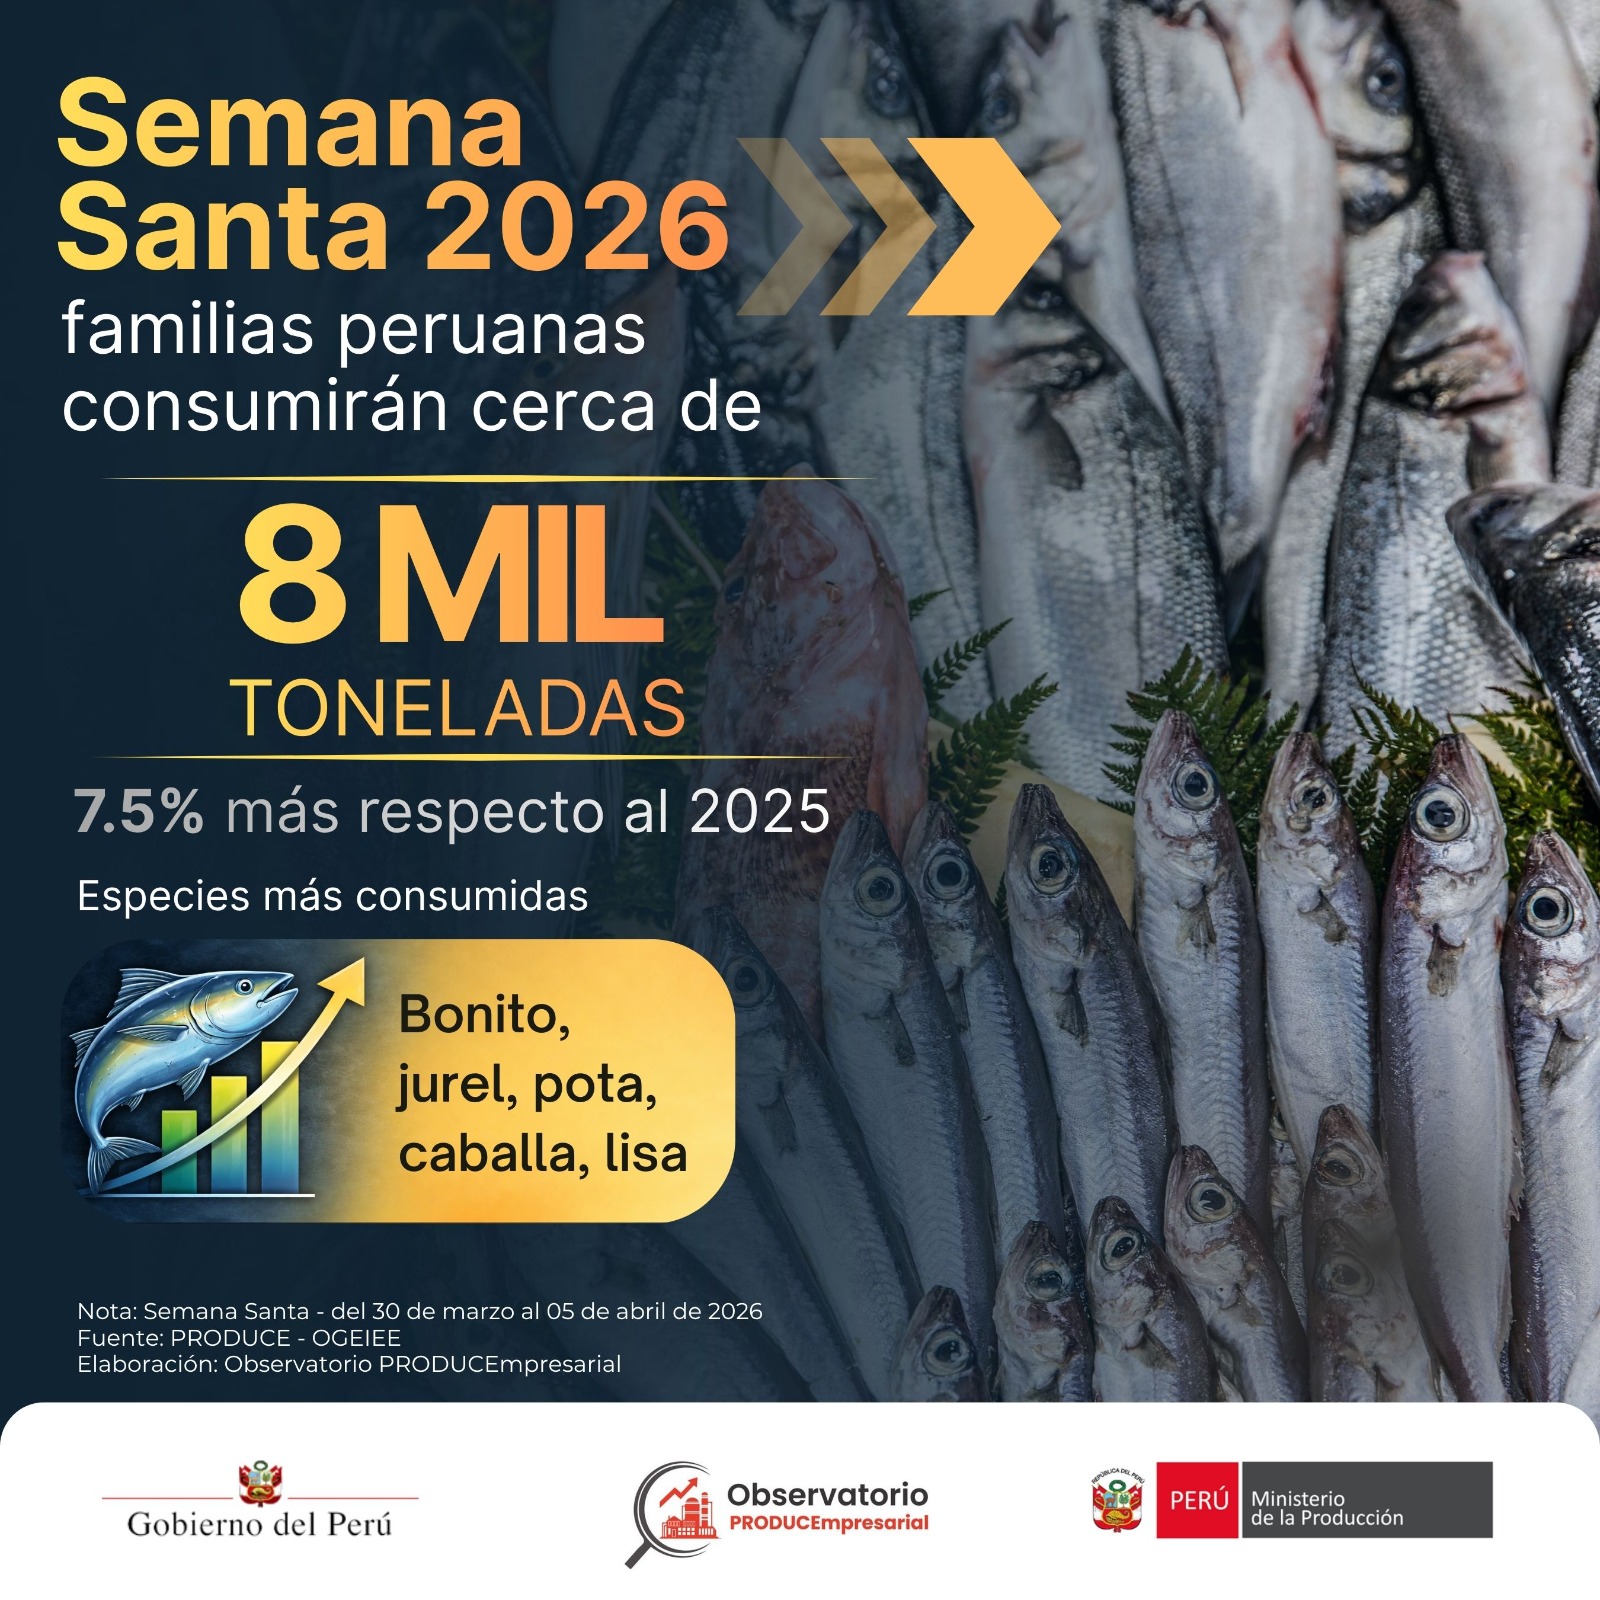
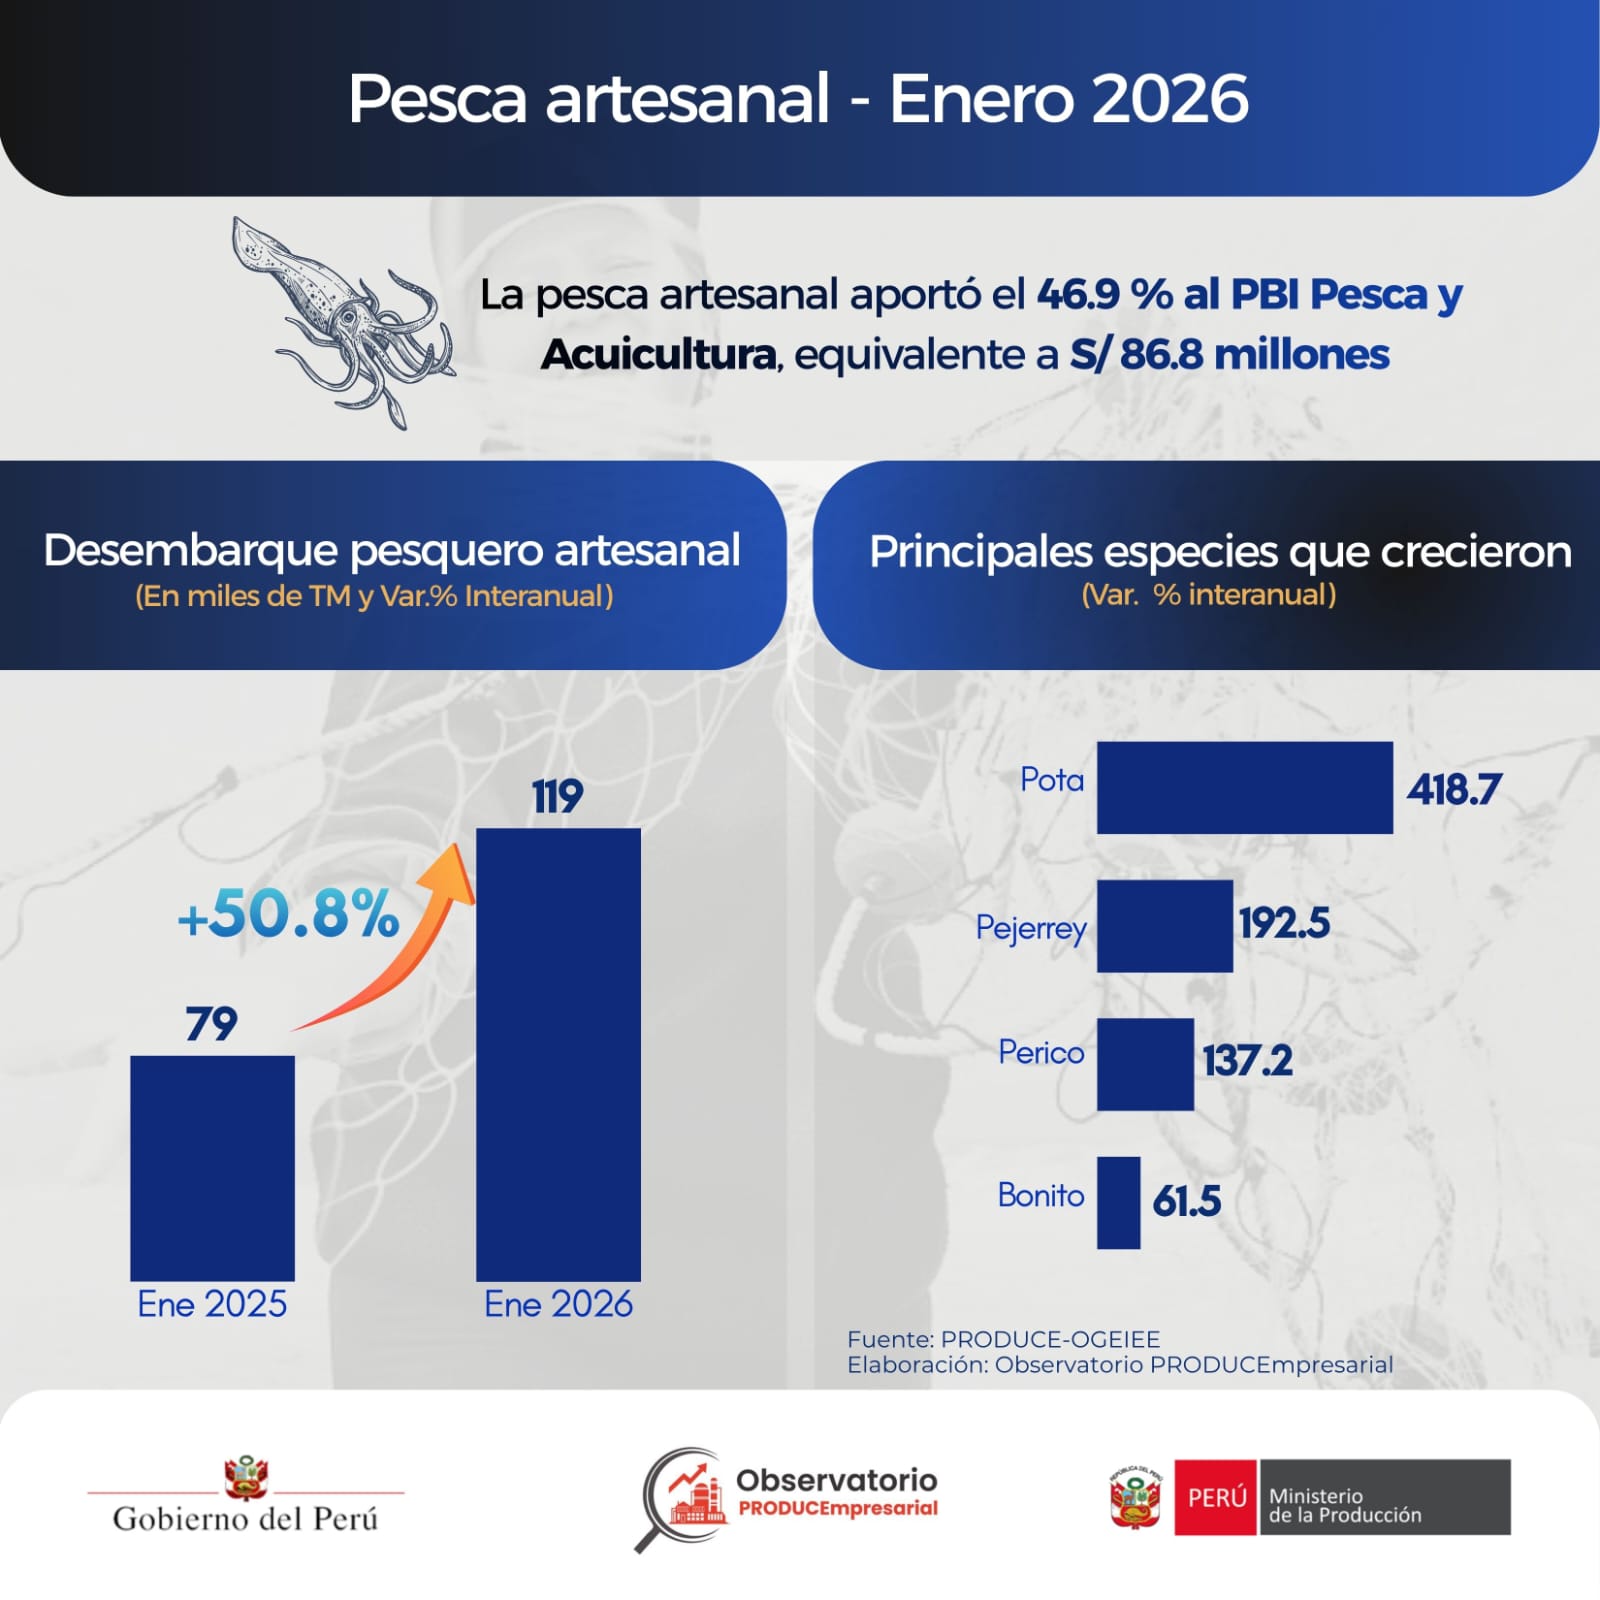
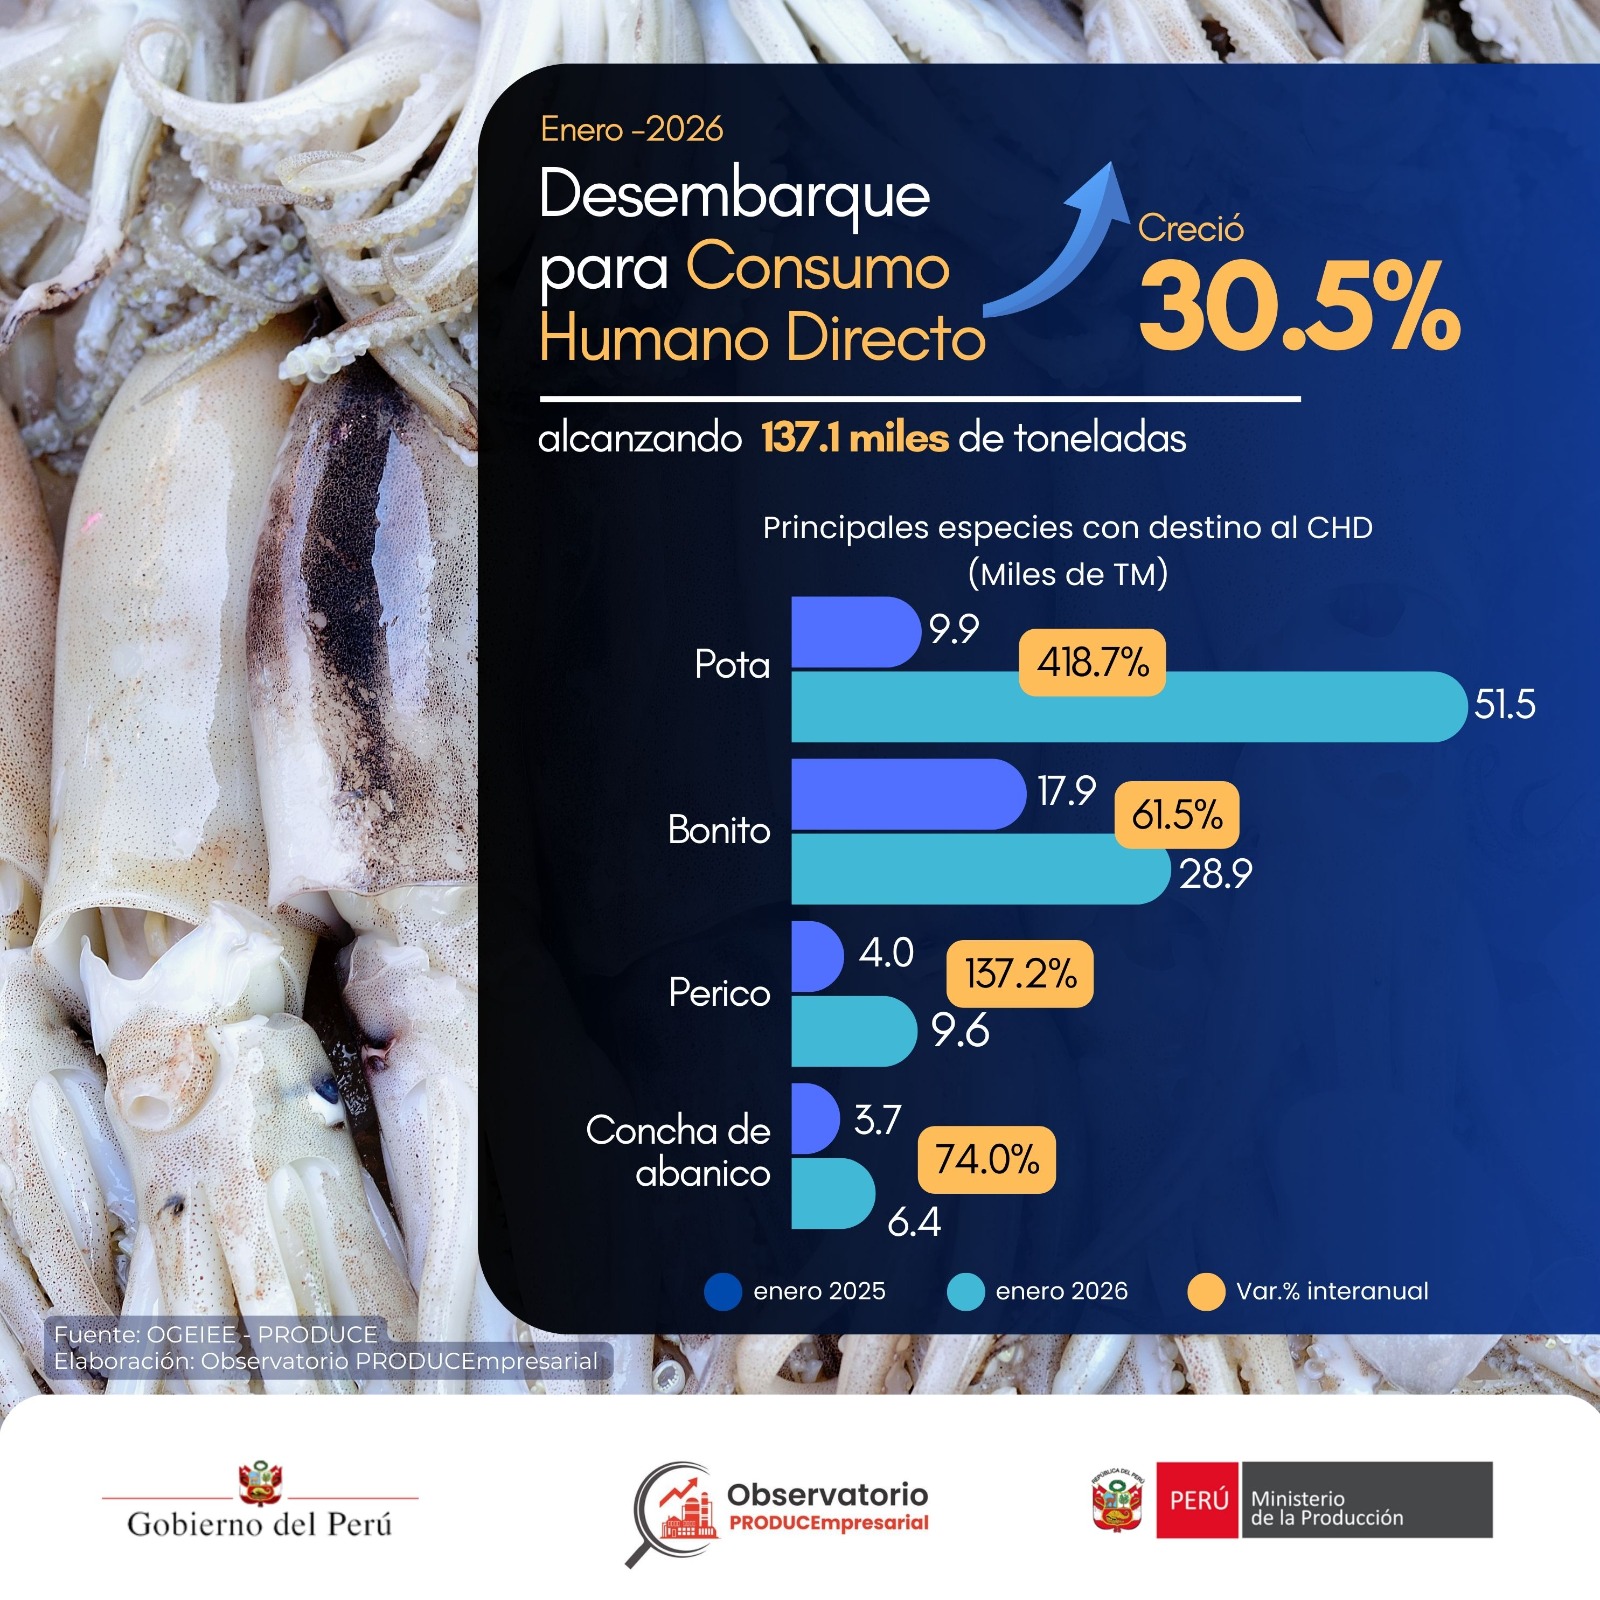
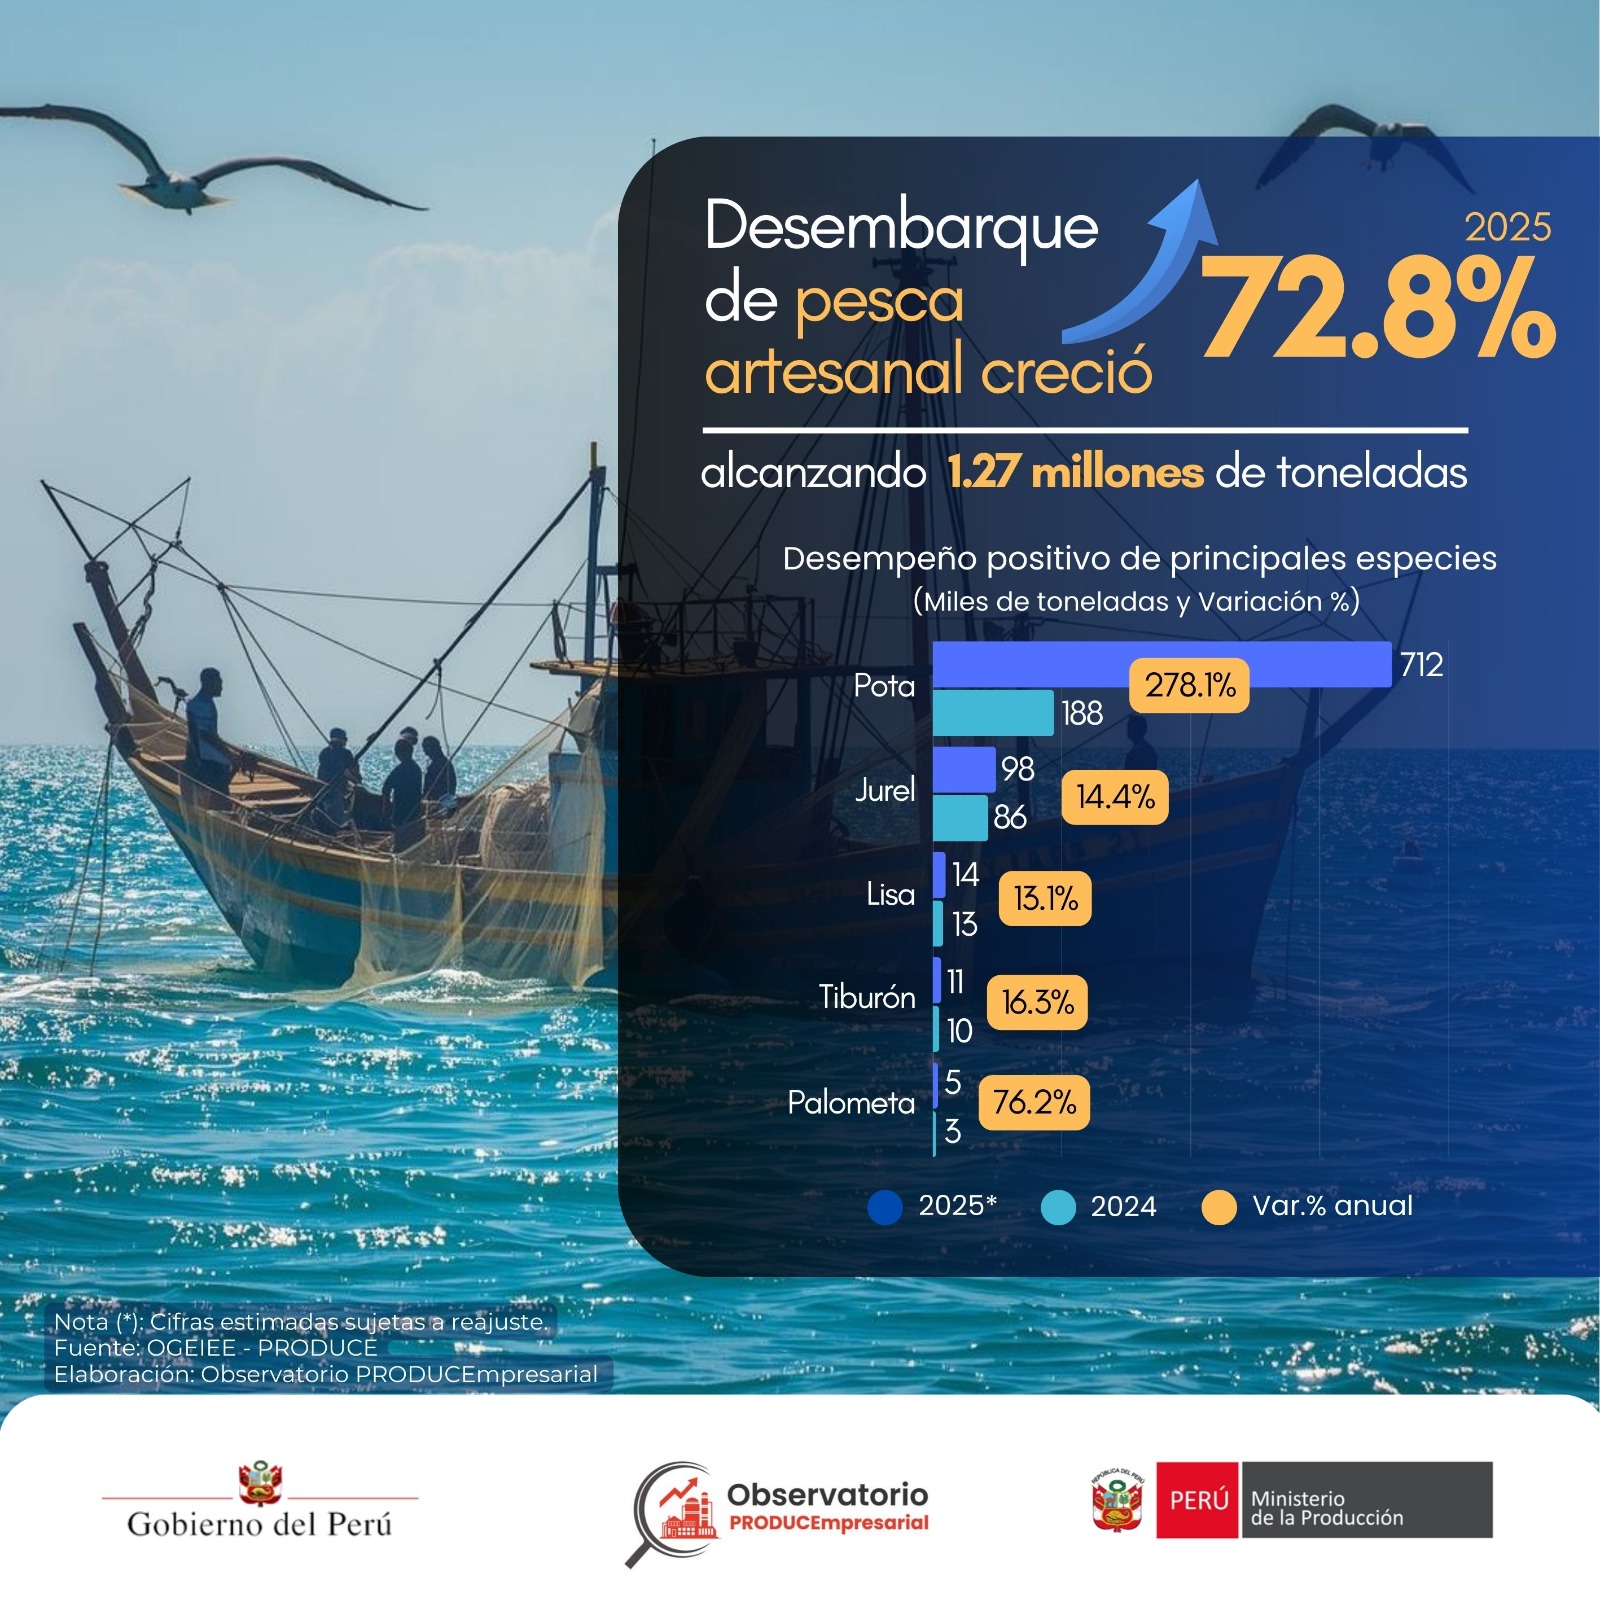
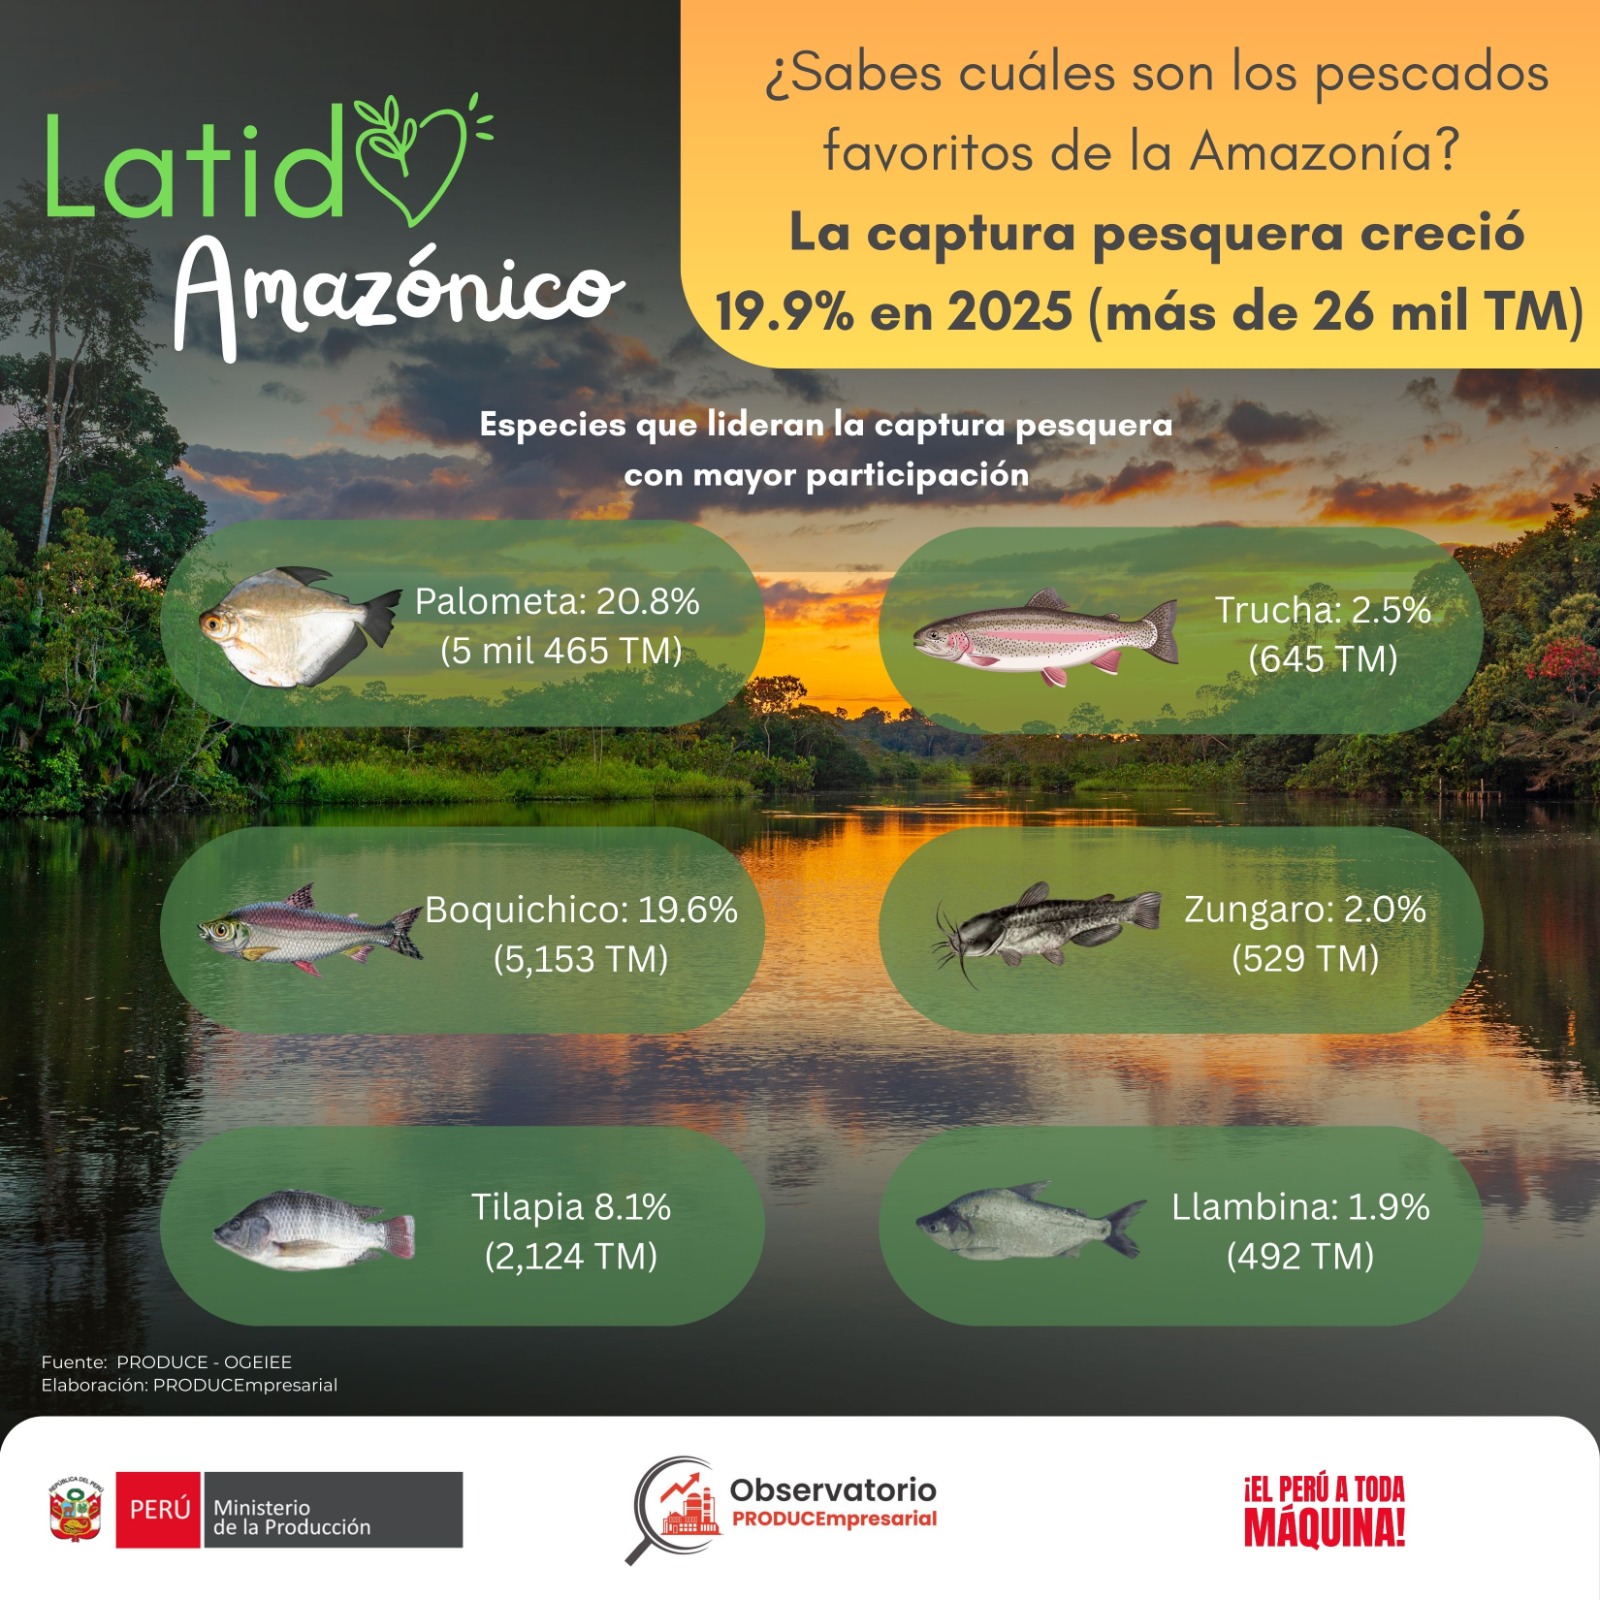
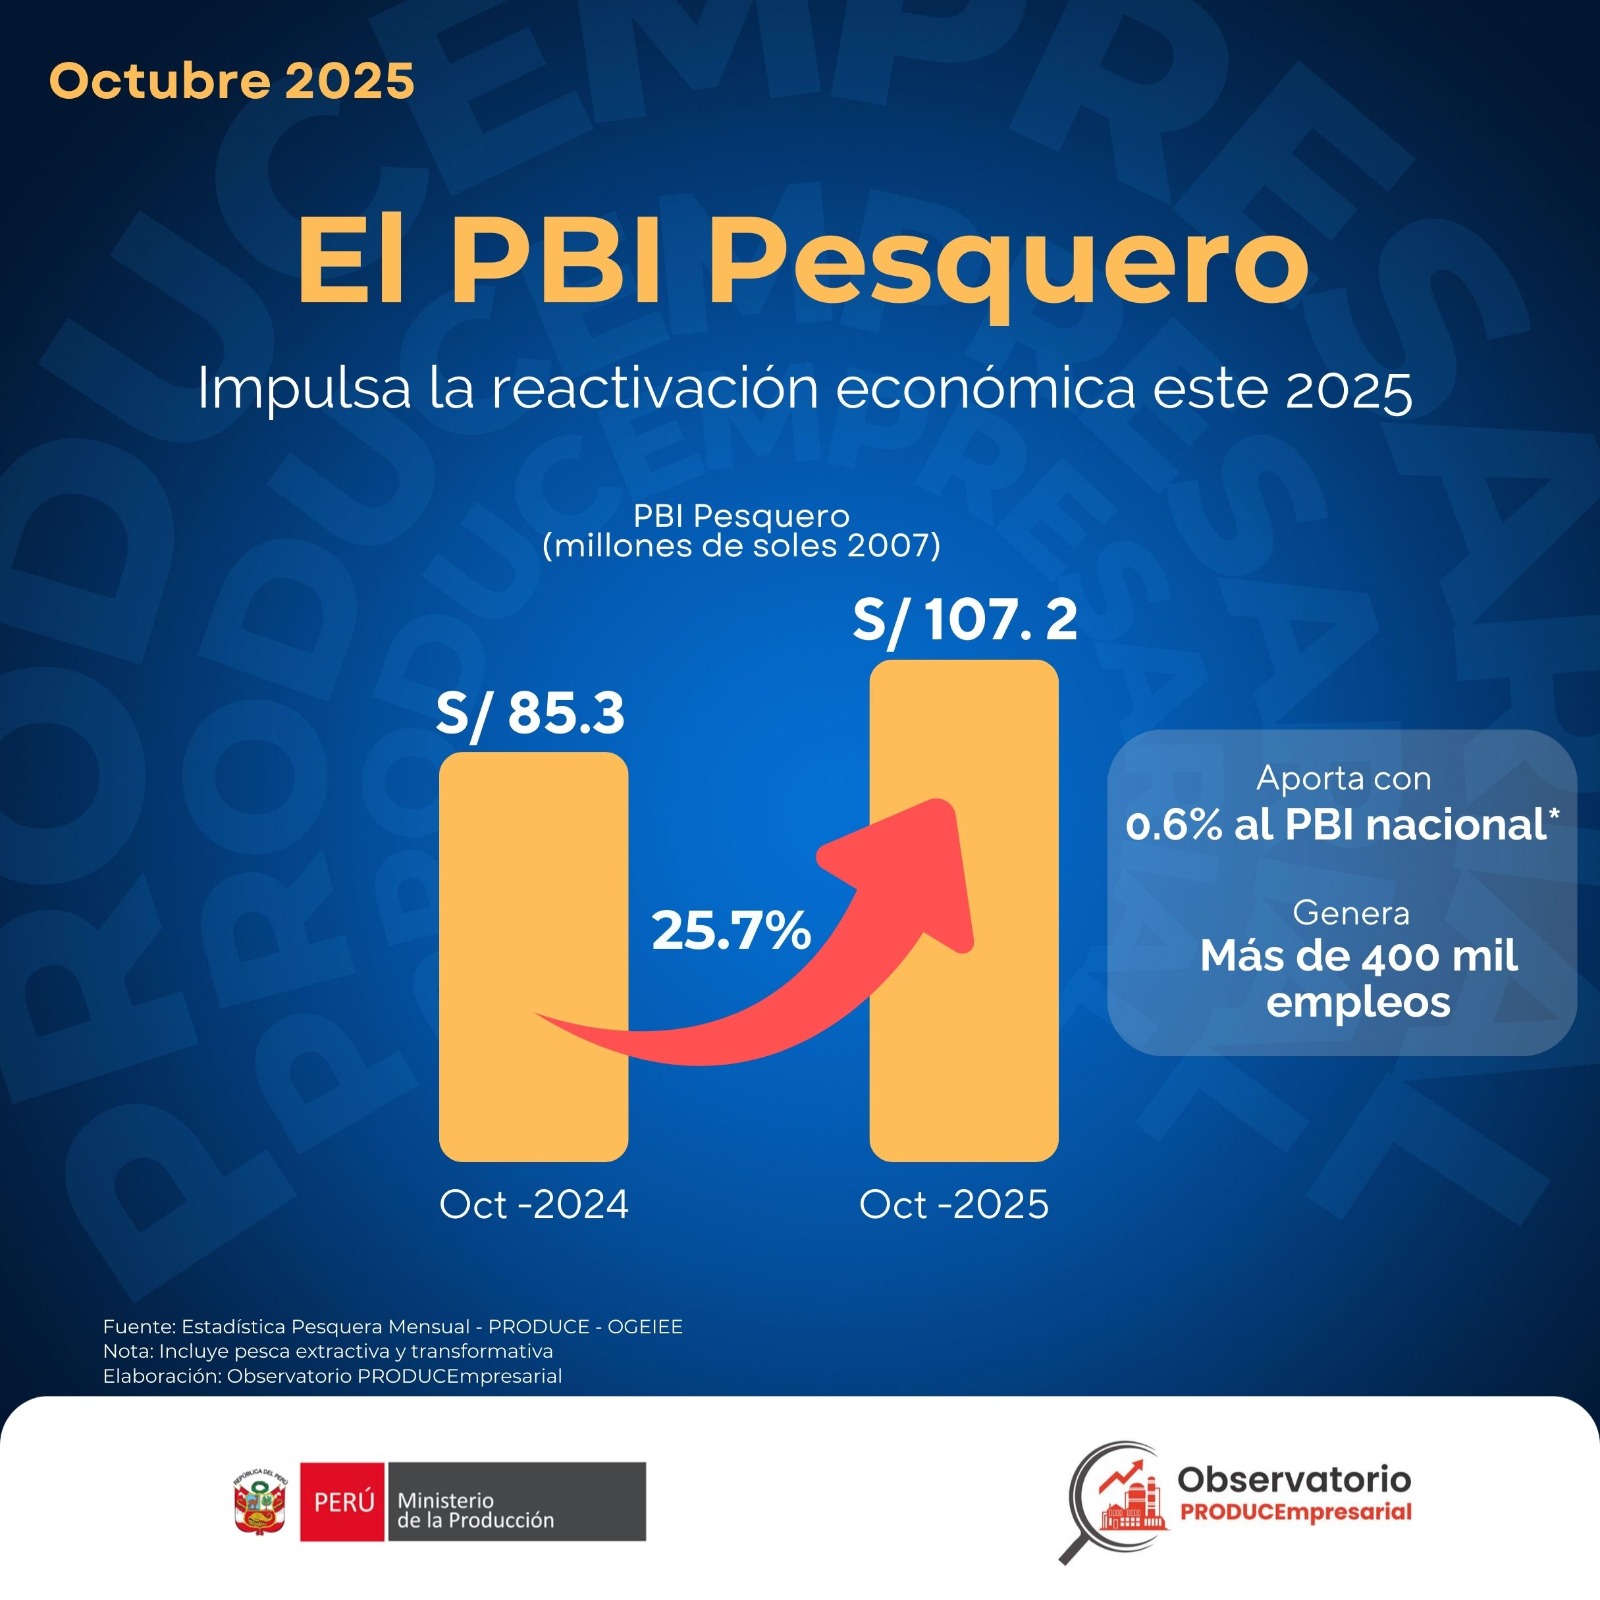
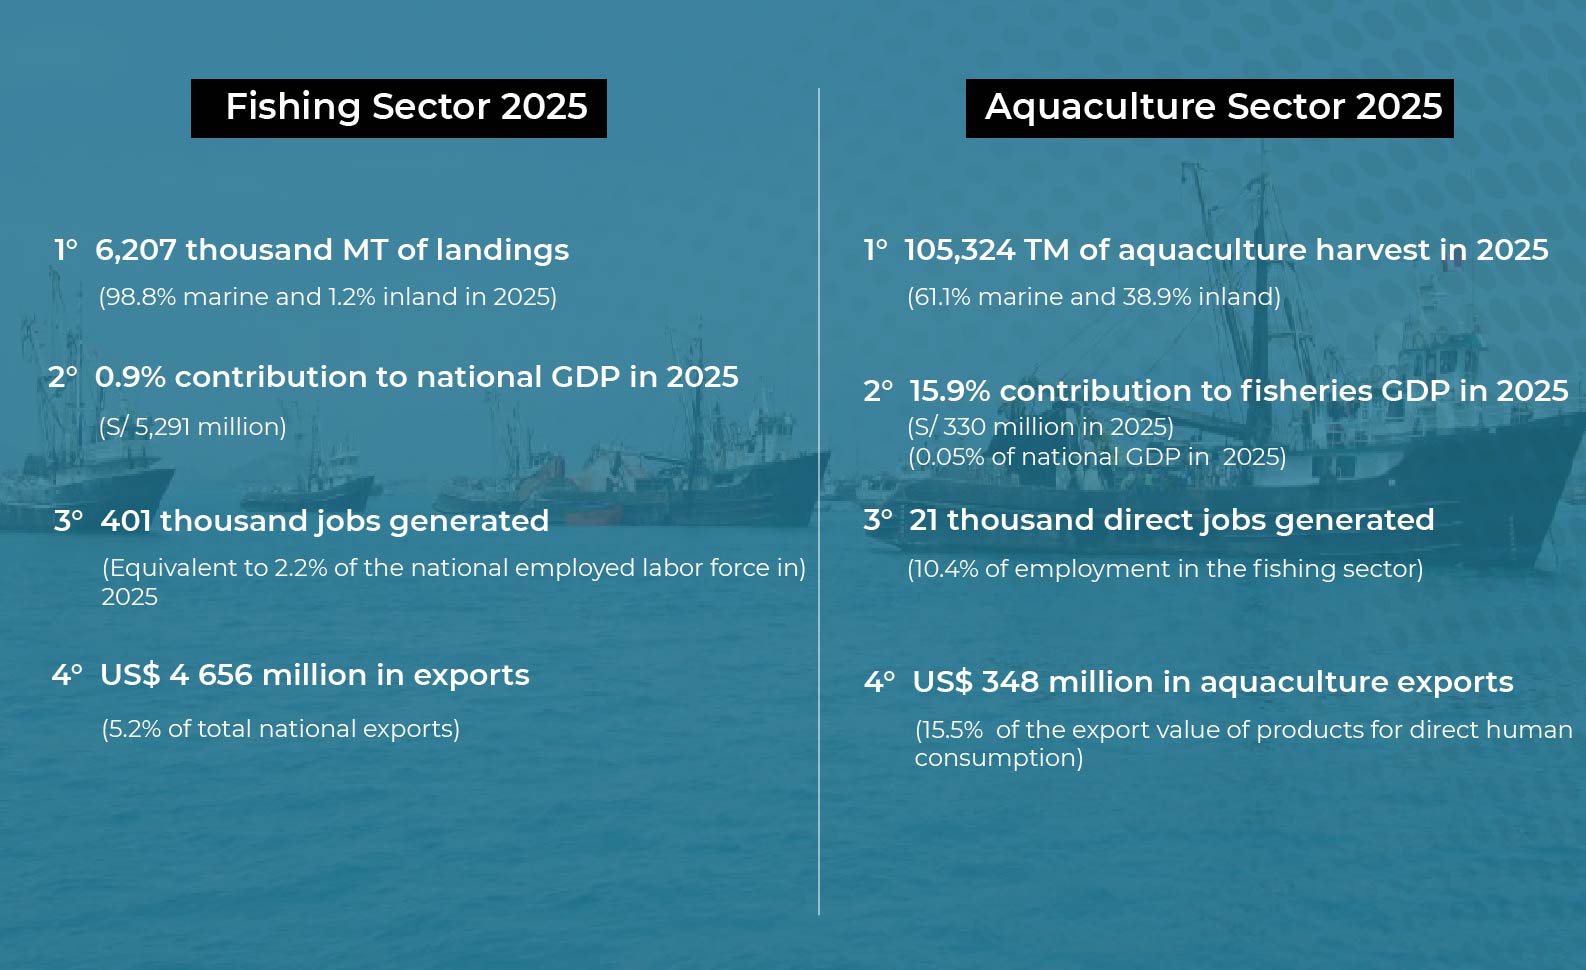
Fishing Sector
january 2026
In January 2026, the fishing sector’s GDP fell 9.6% year-on-year. This result is mainly explained by lower anchovy extraction for industrial fishmeal and fish oil production. In addition, landings totalled 430.4 thousand metric tons, representing a 29.8% decrease from January 2025 (613.2 thousand metric tons).
02
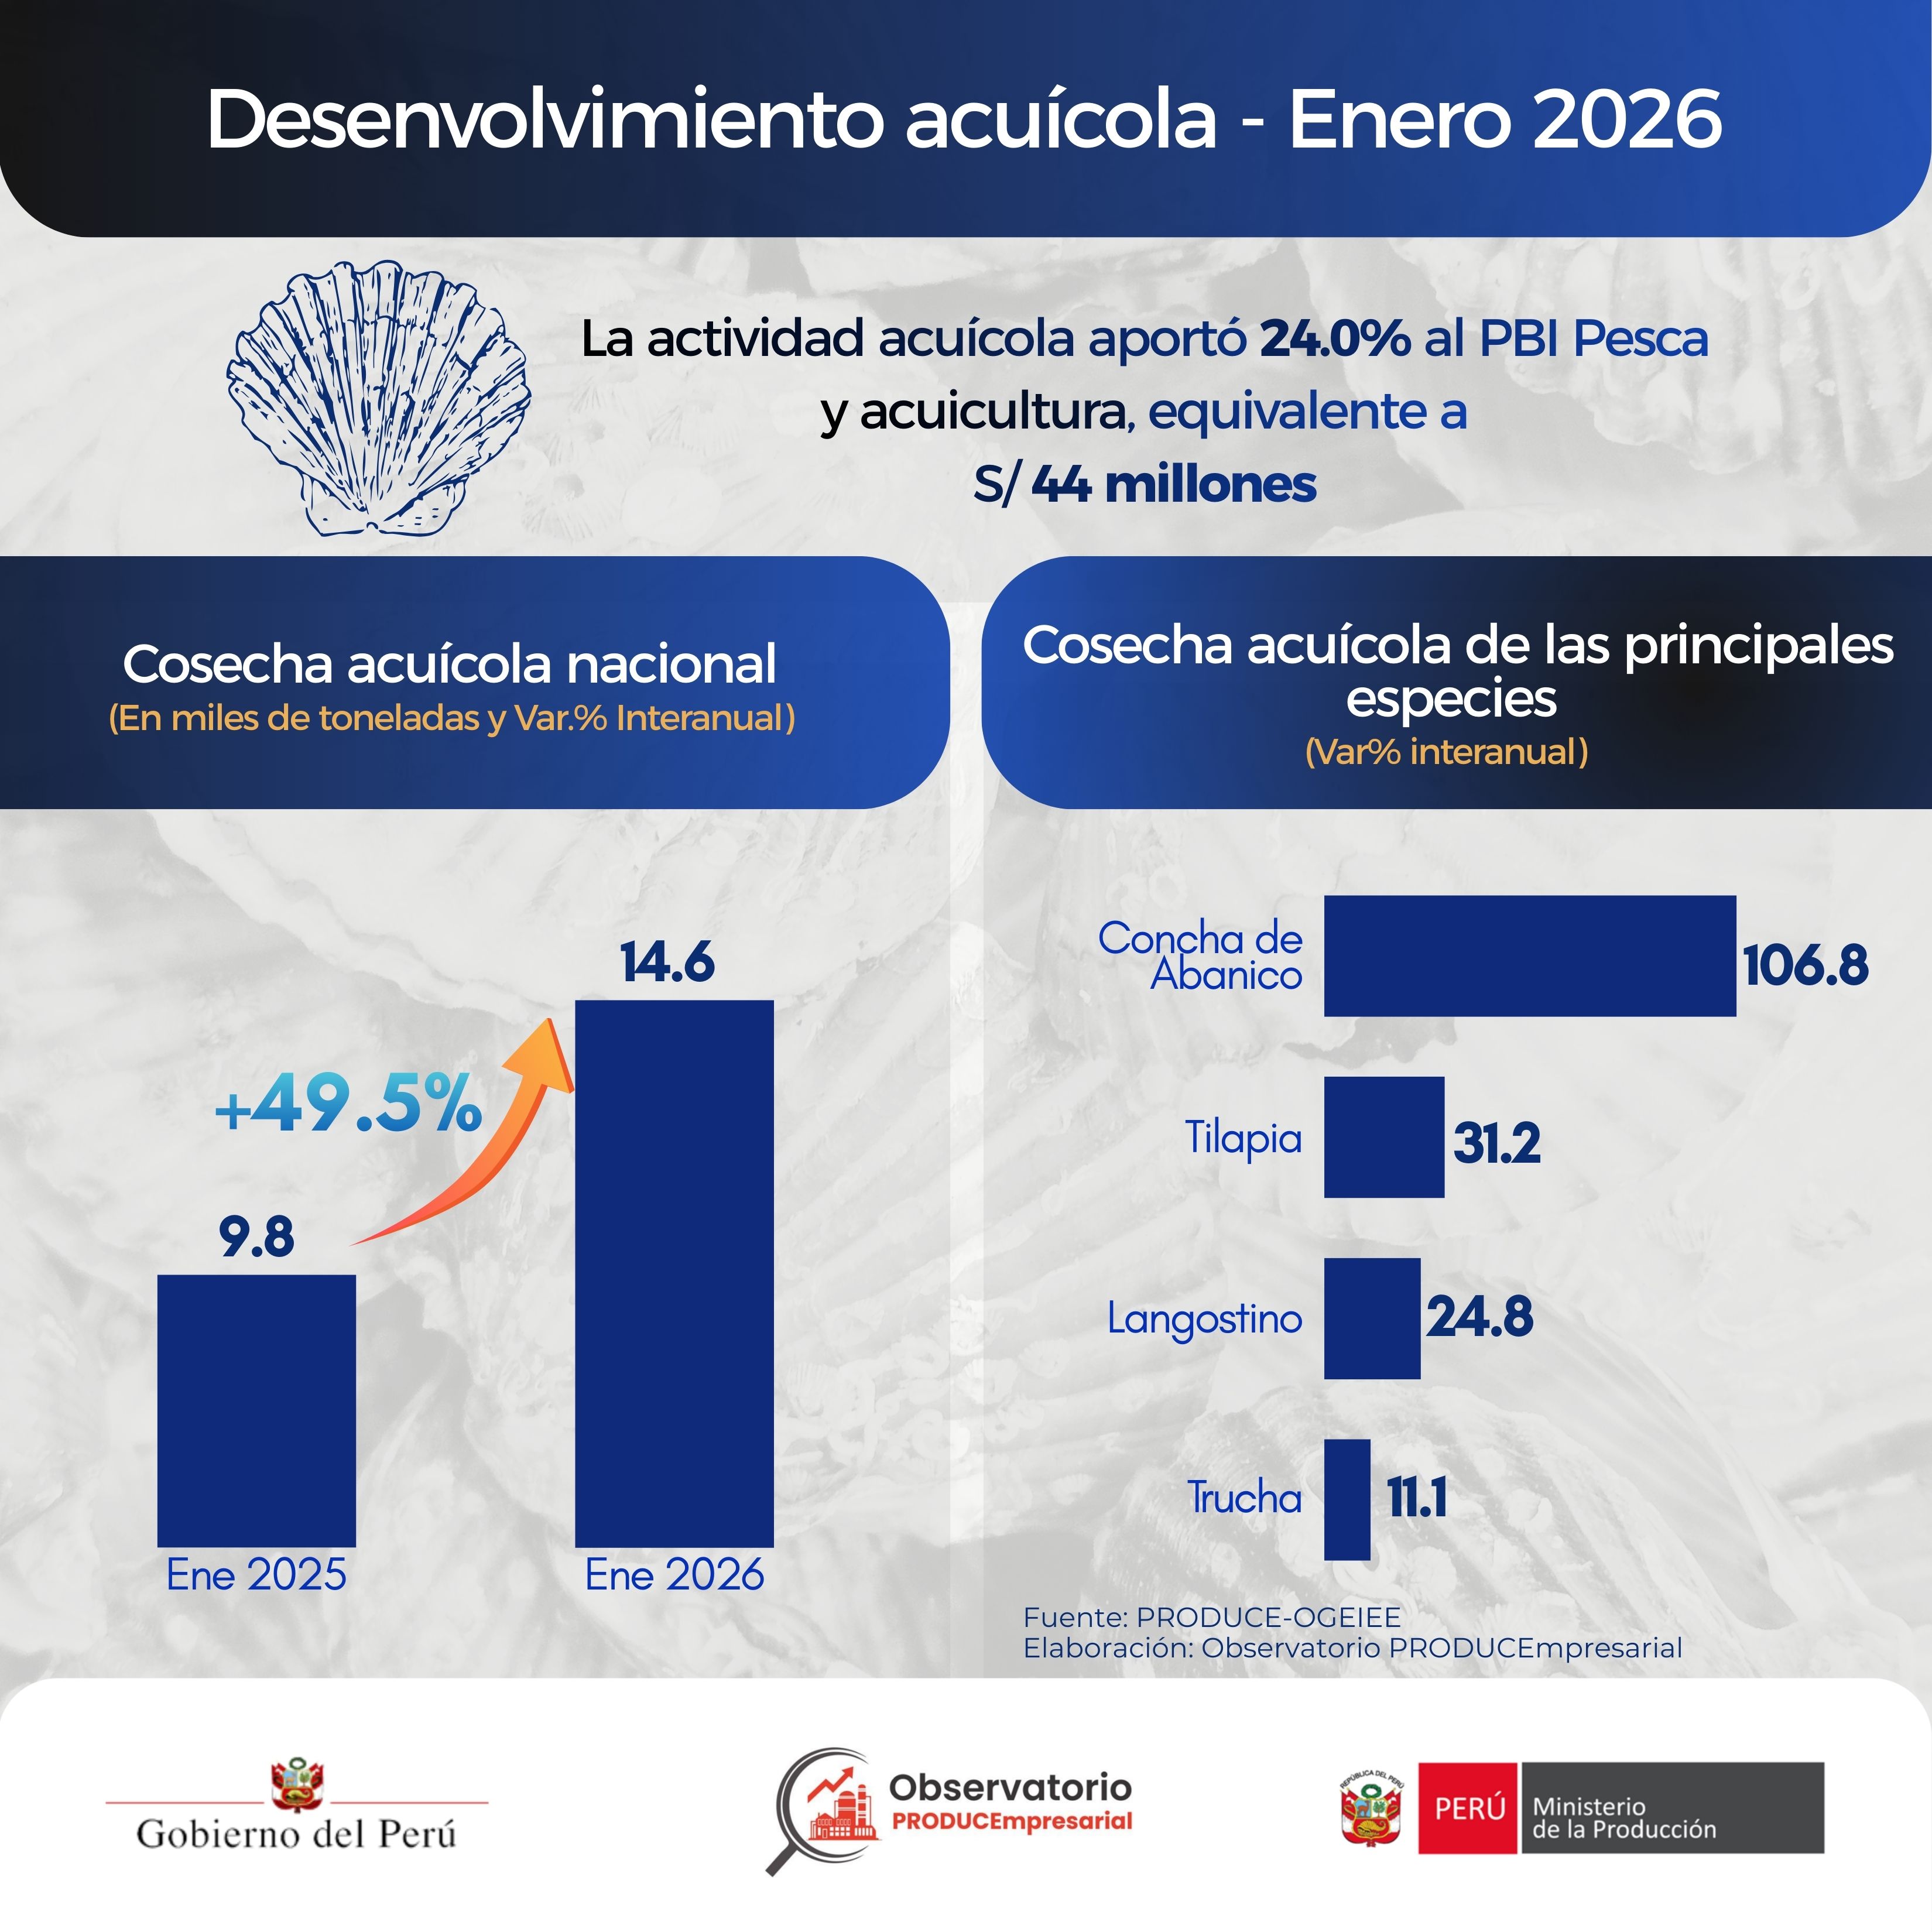
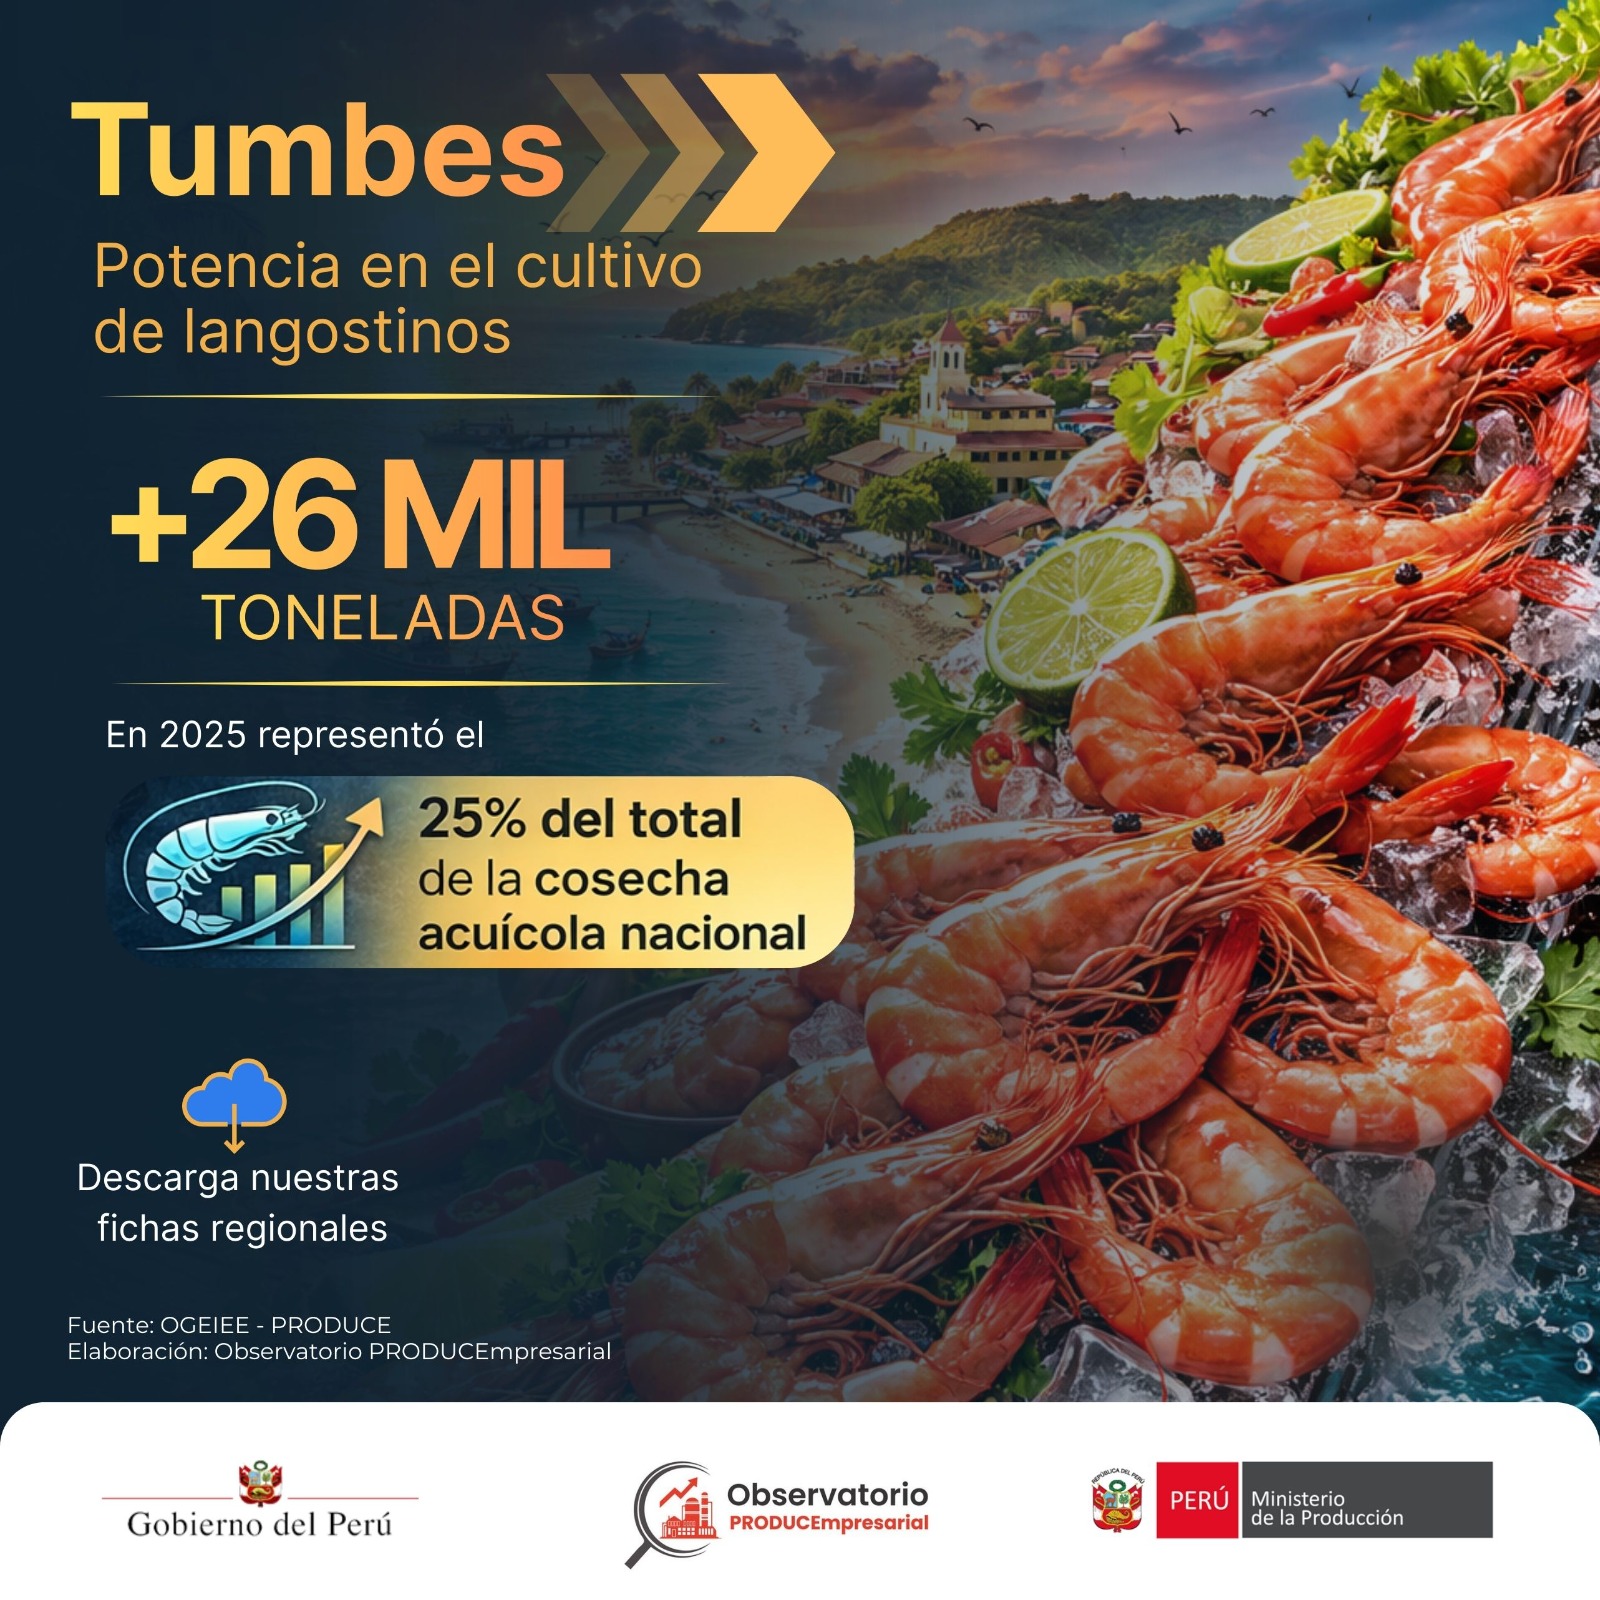
Aquaculture
january 2026
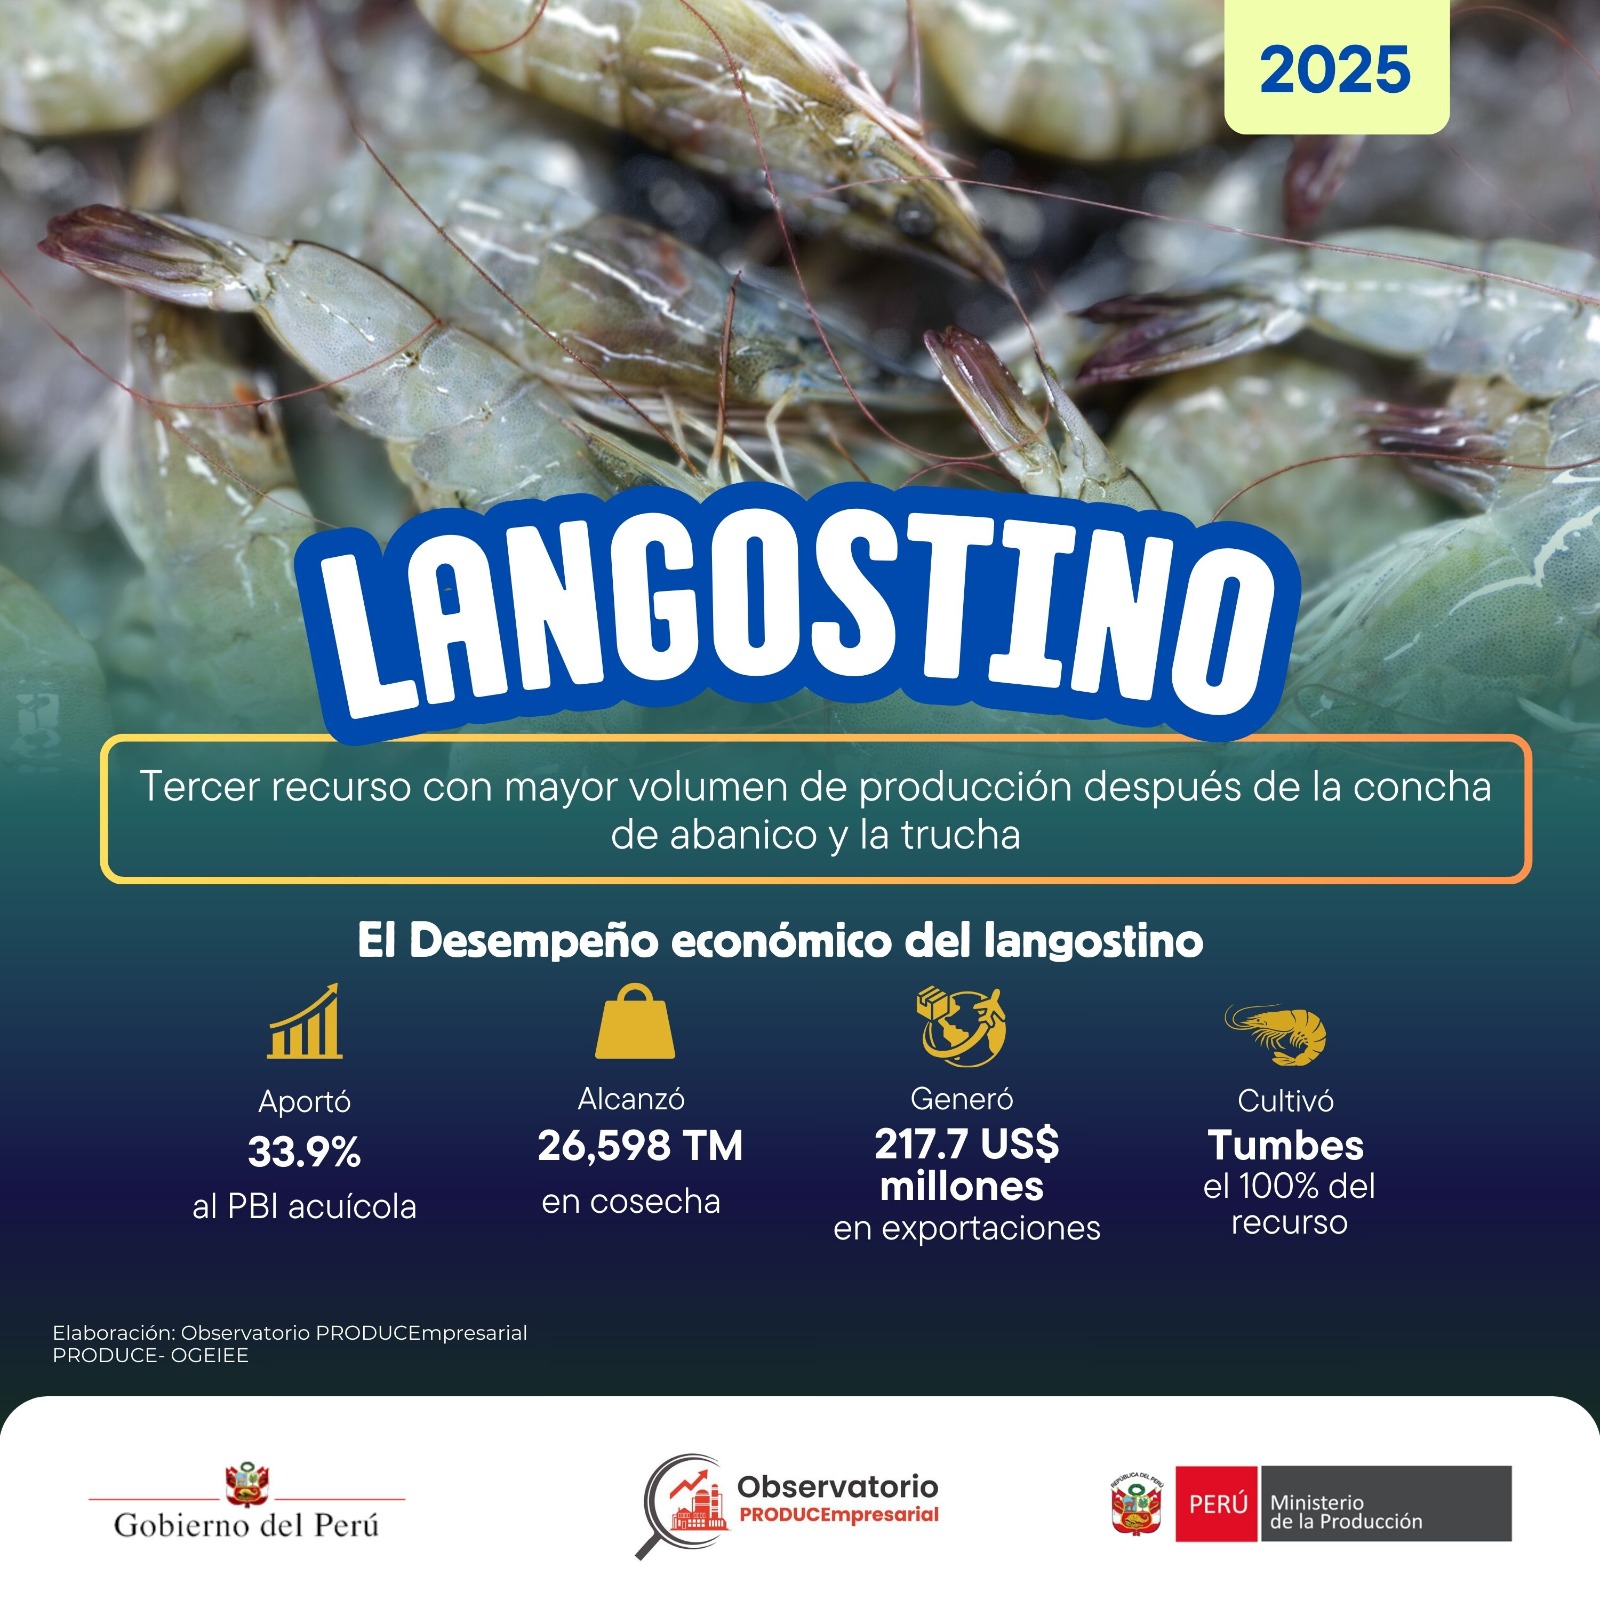
In January 2026, aquaculture harvests grew 49.5% year-on-year. This result was mainly driven by higher harvests of scallops (+106.8%), shrimp (+24.8%), trout (+11.1%), and tilapia (+31.2%), supported by improved weather conditions.
03
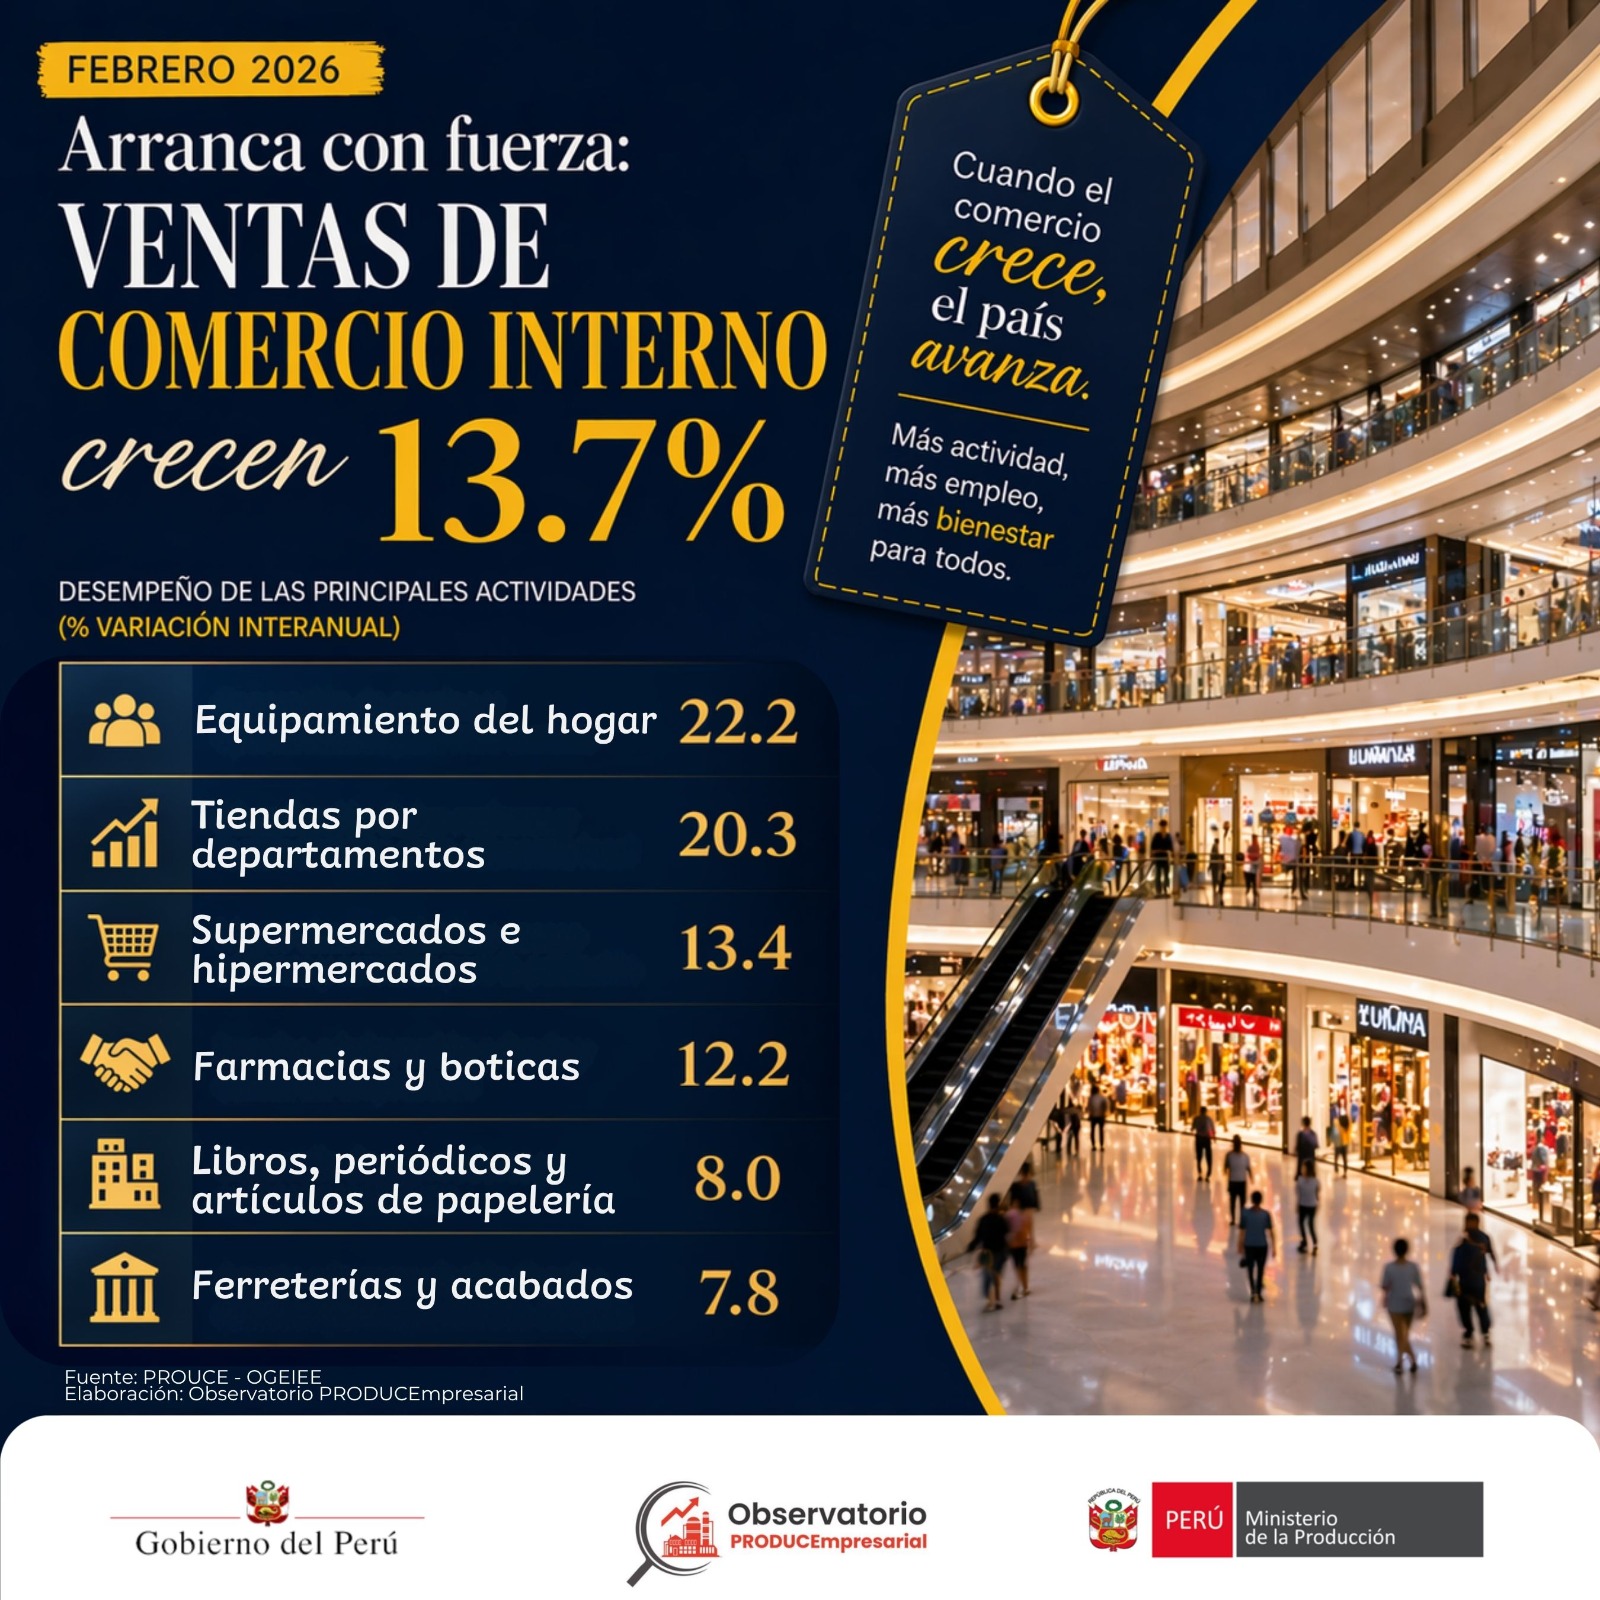
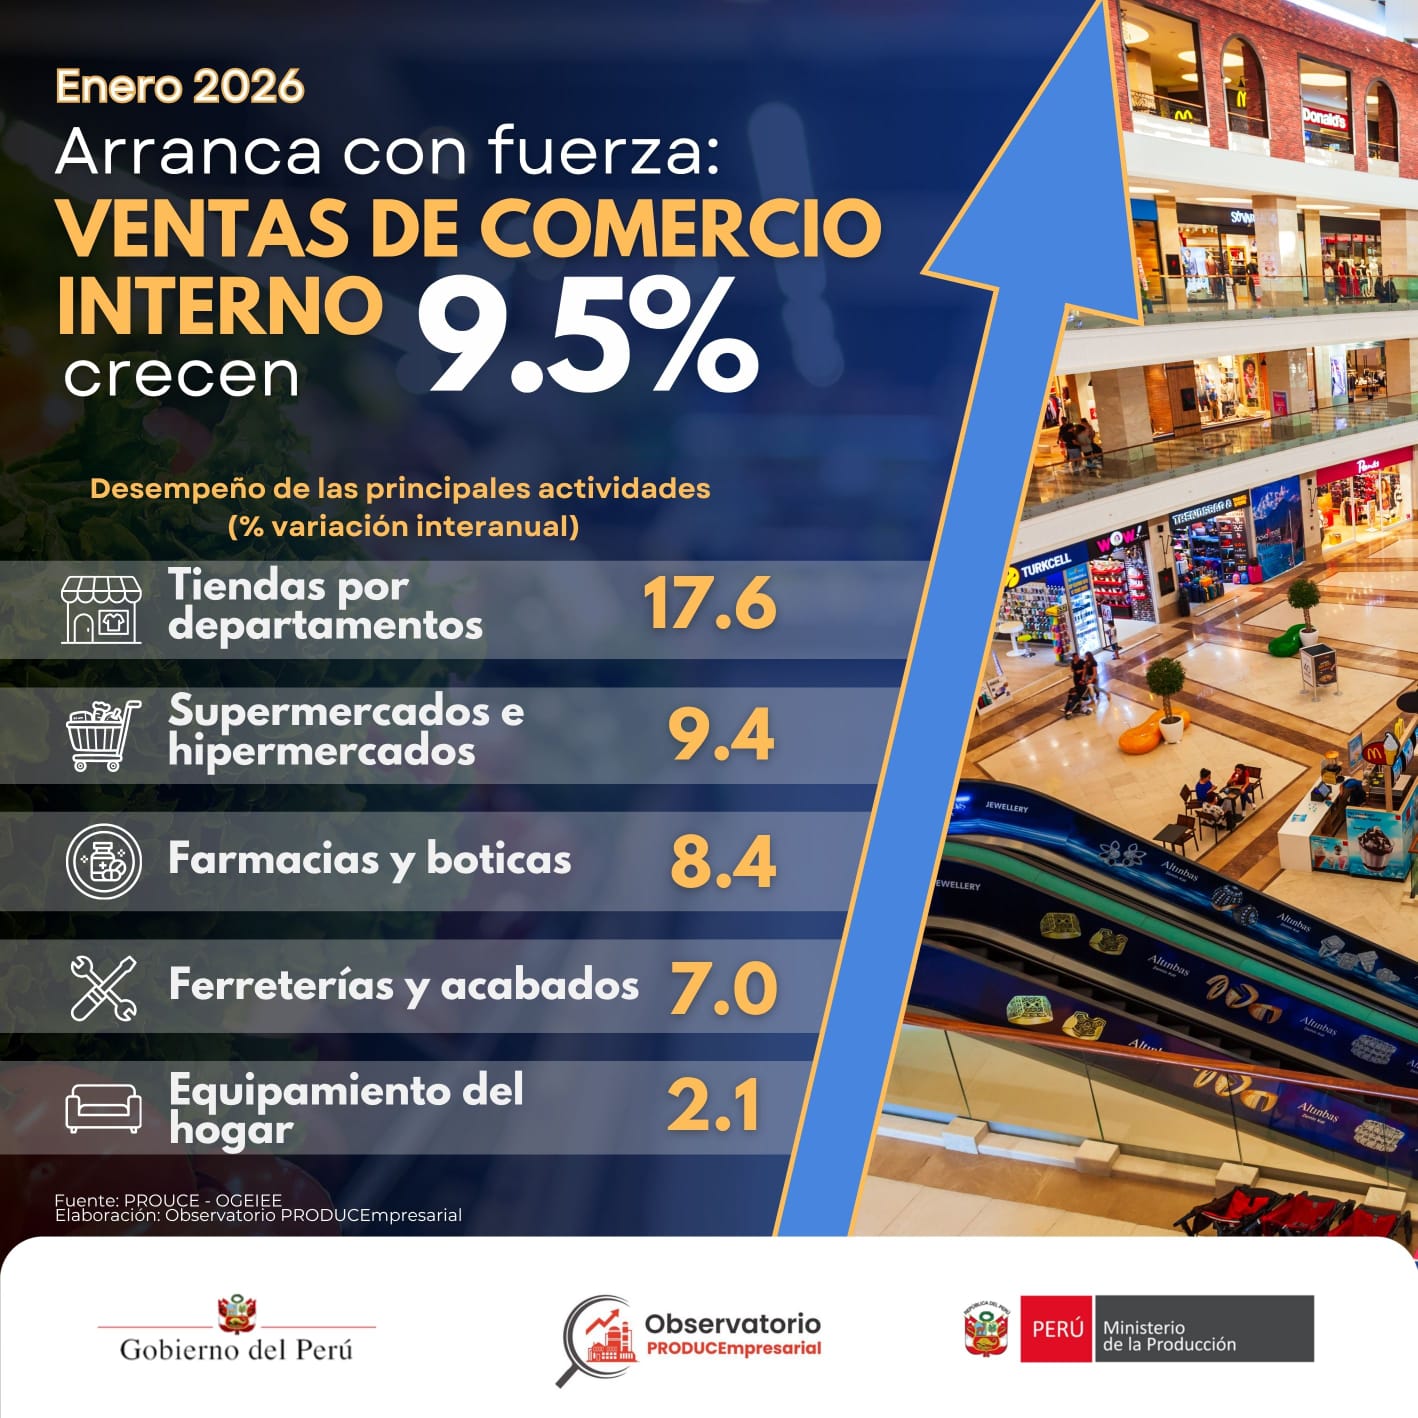
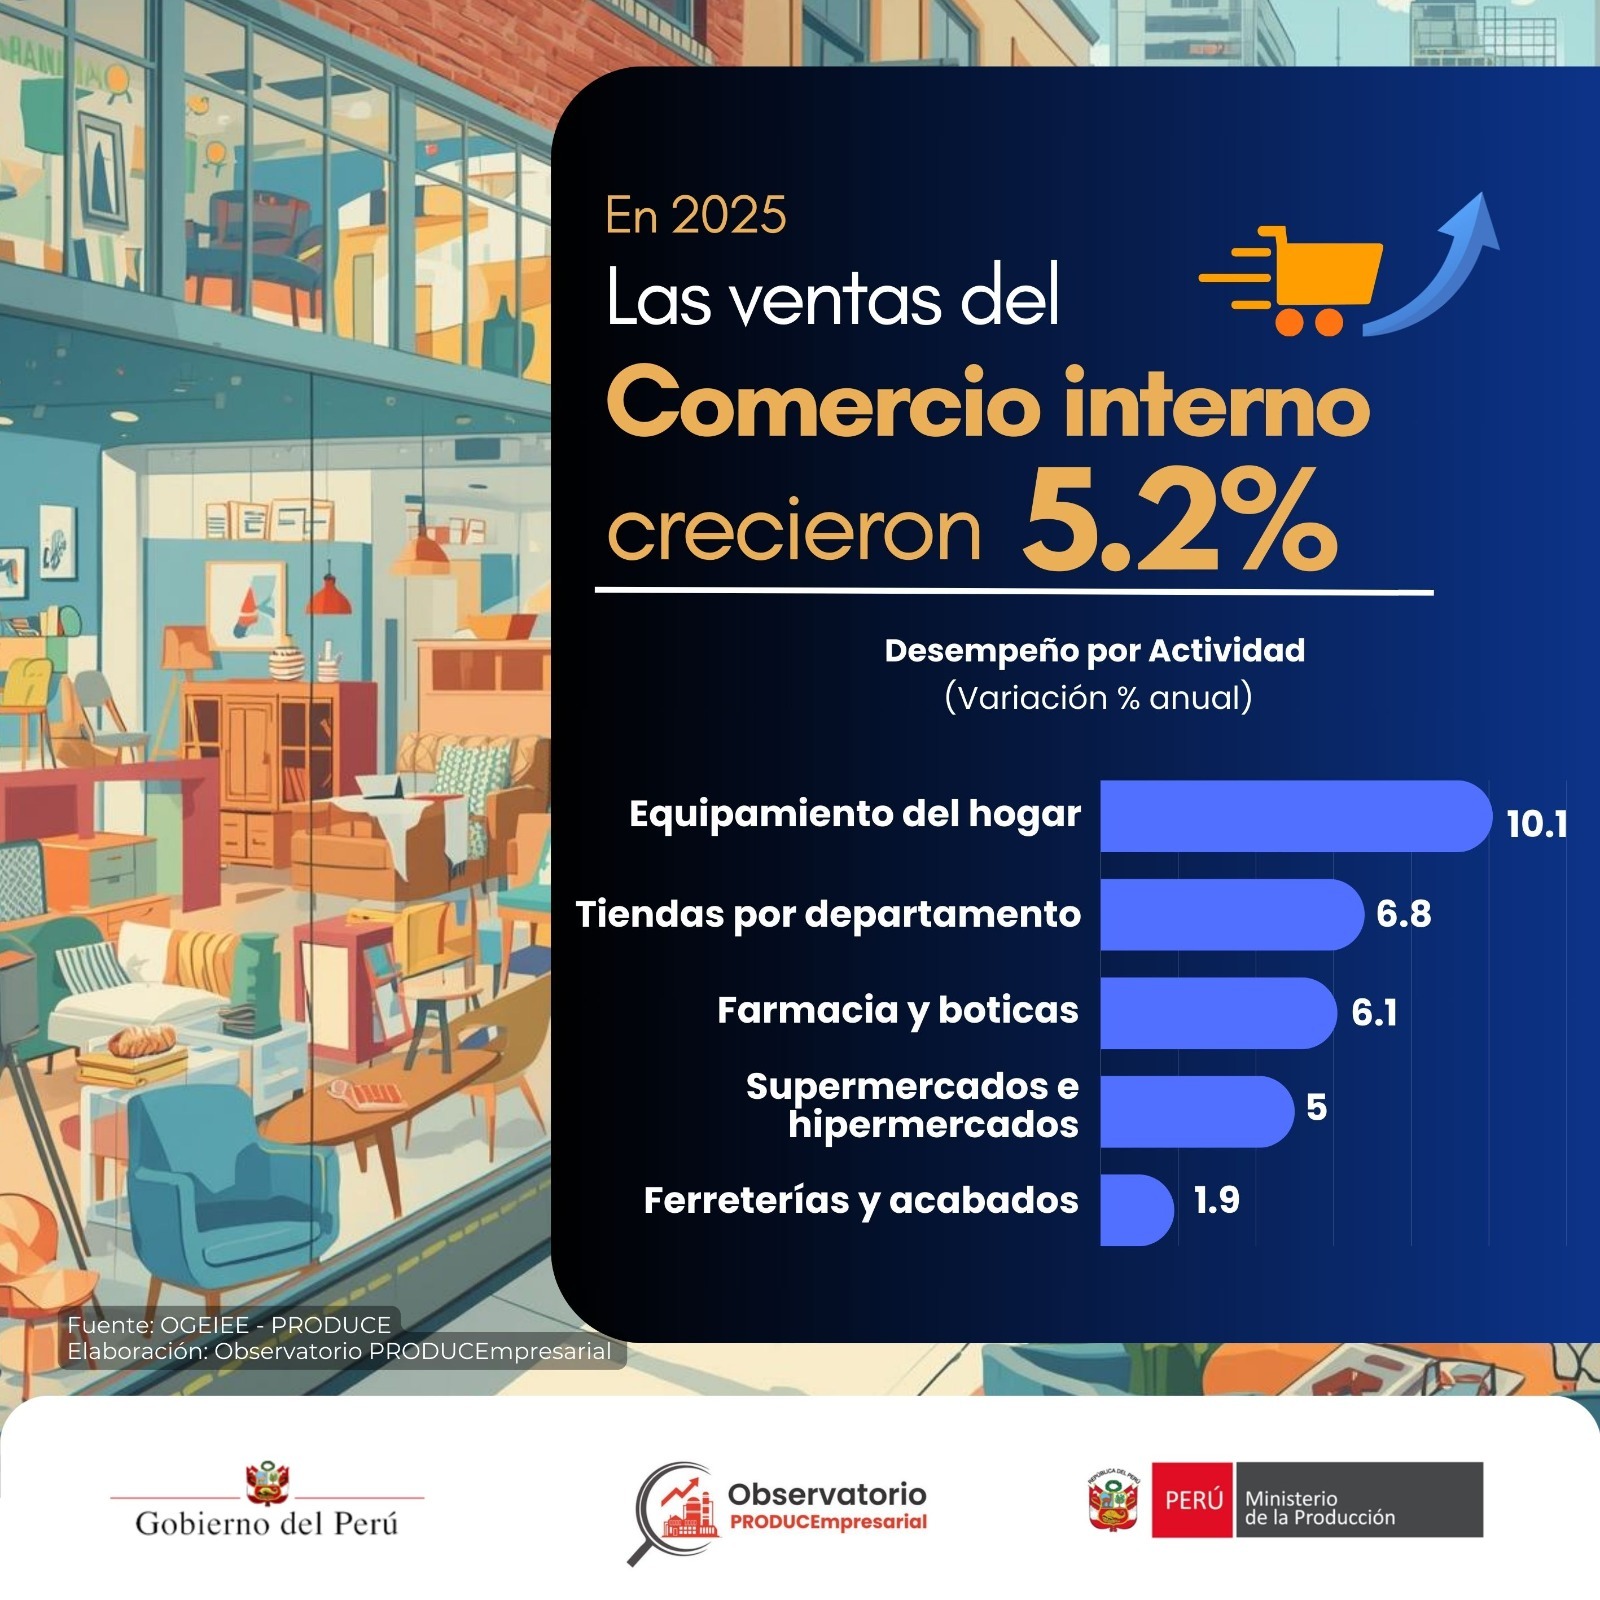
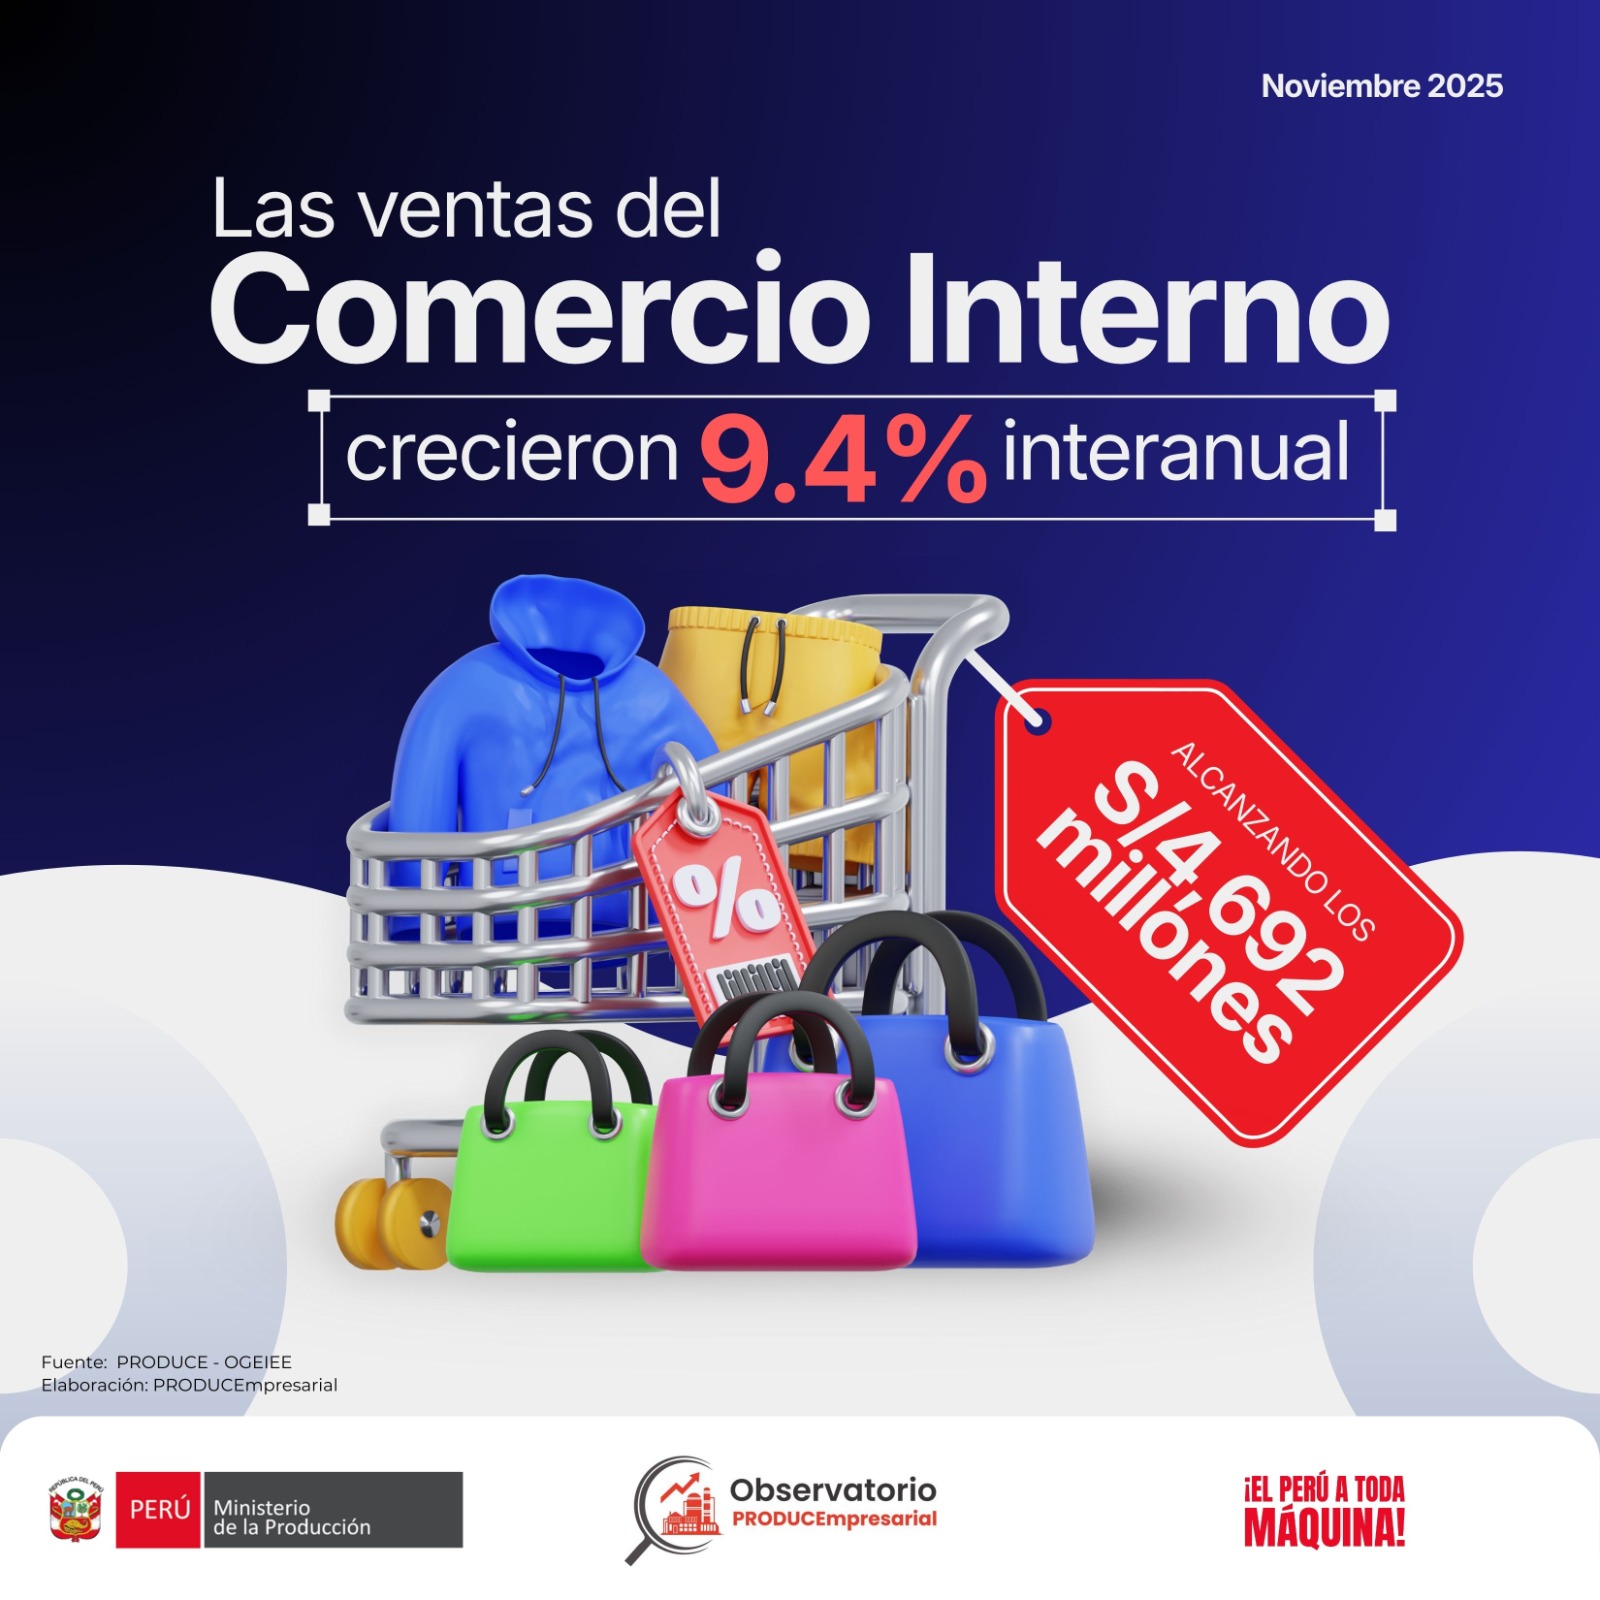
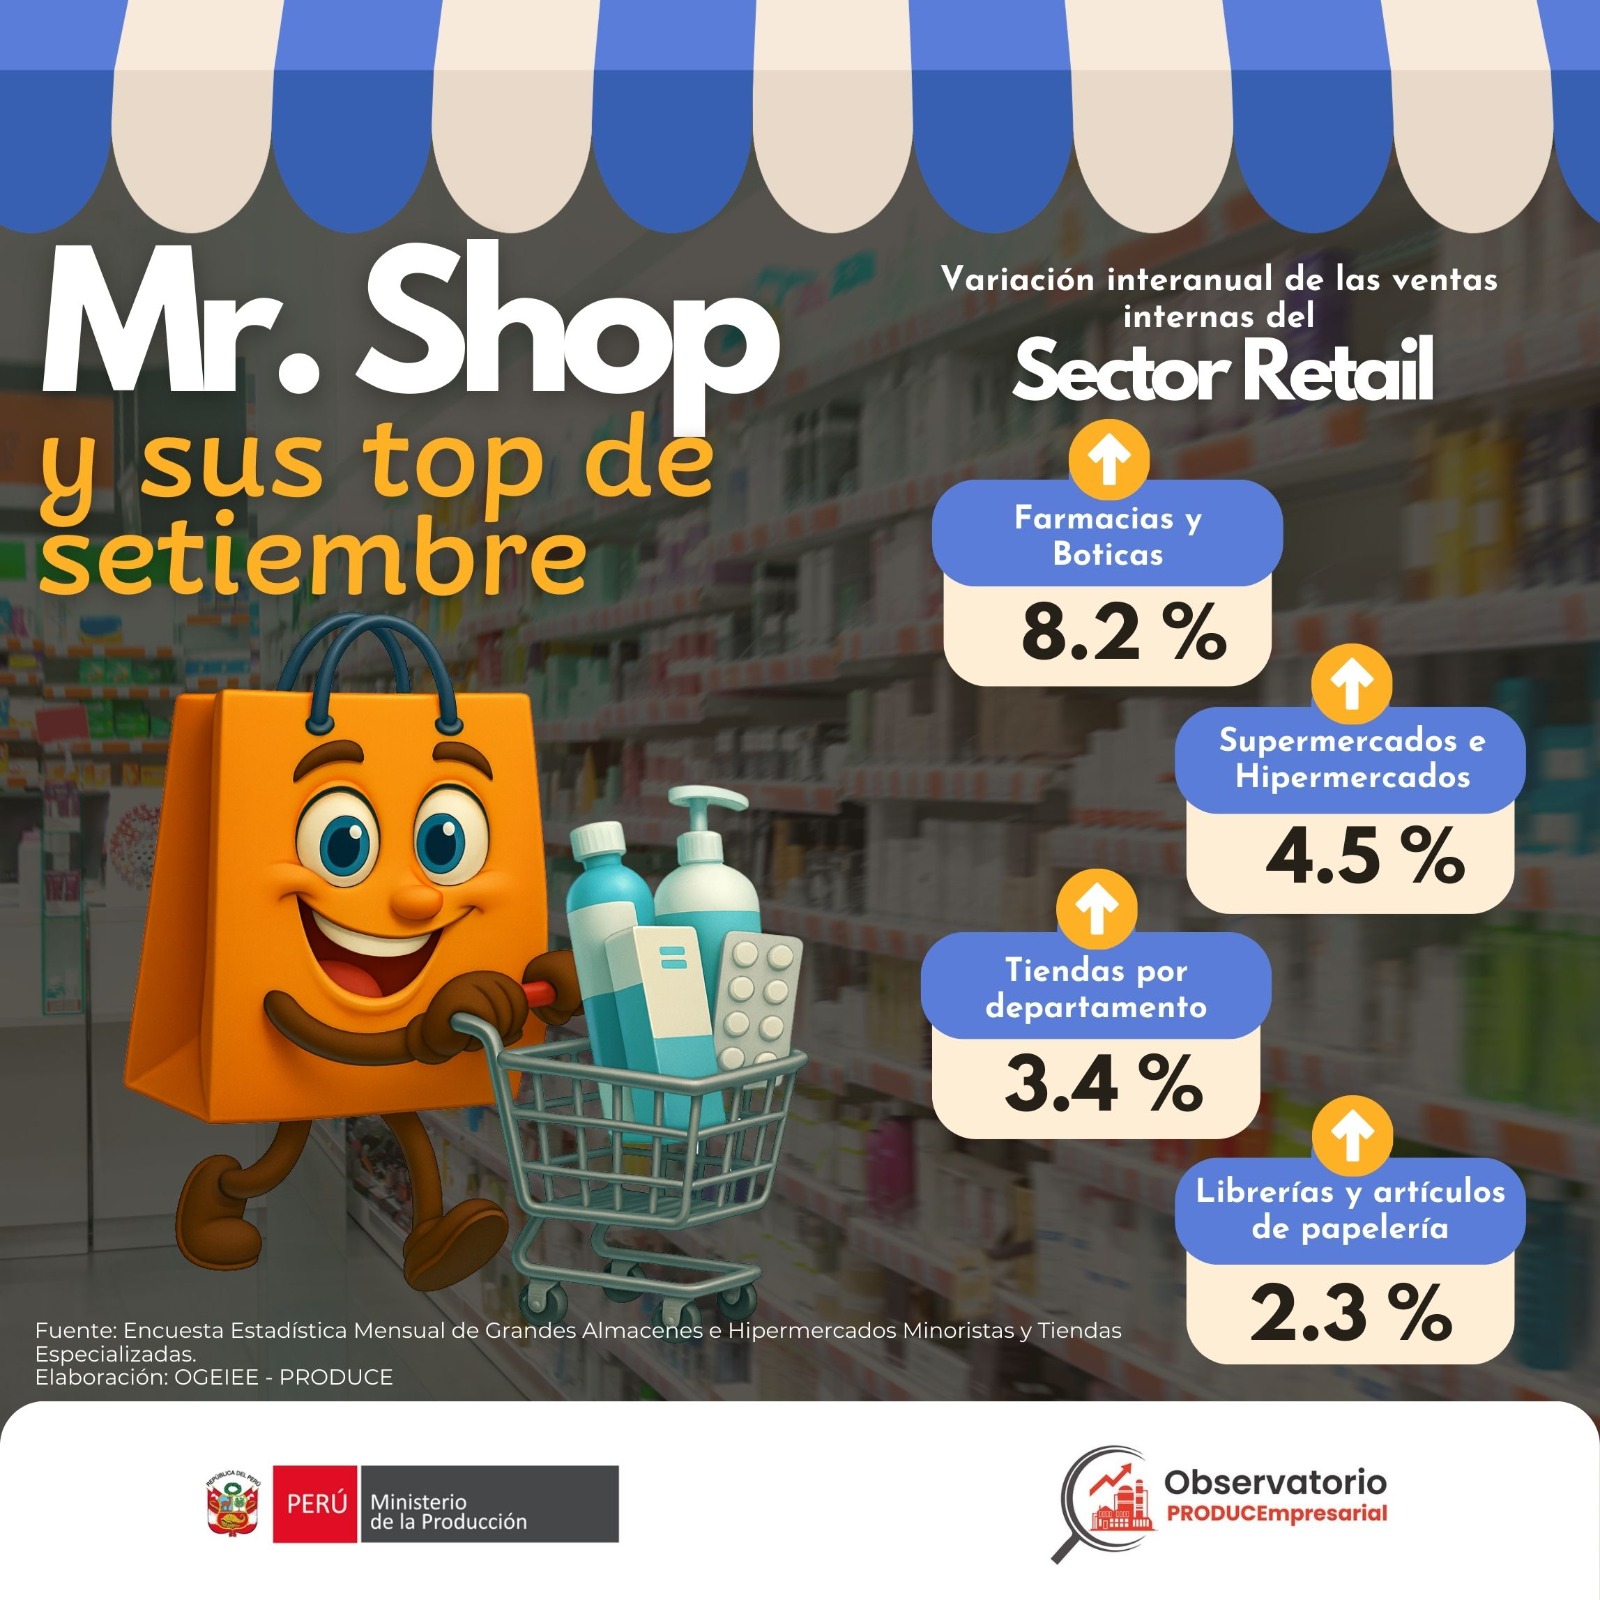
Domestic Trade
january 2026
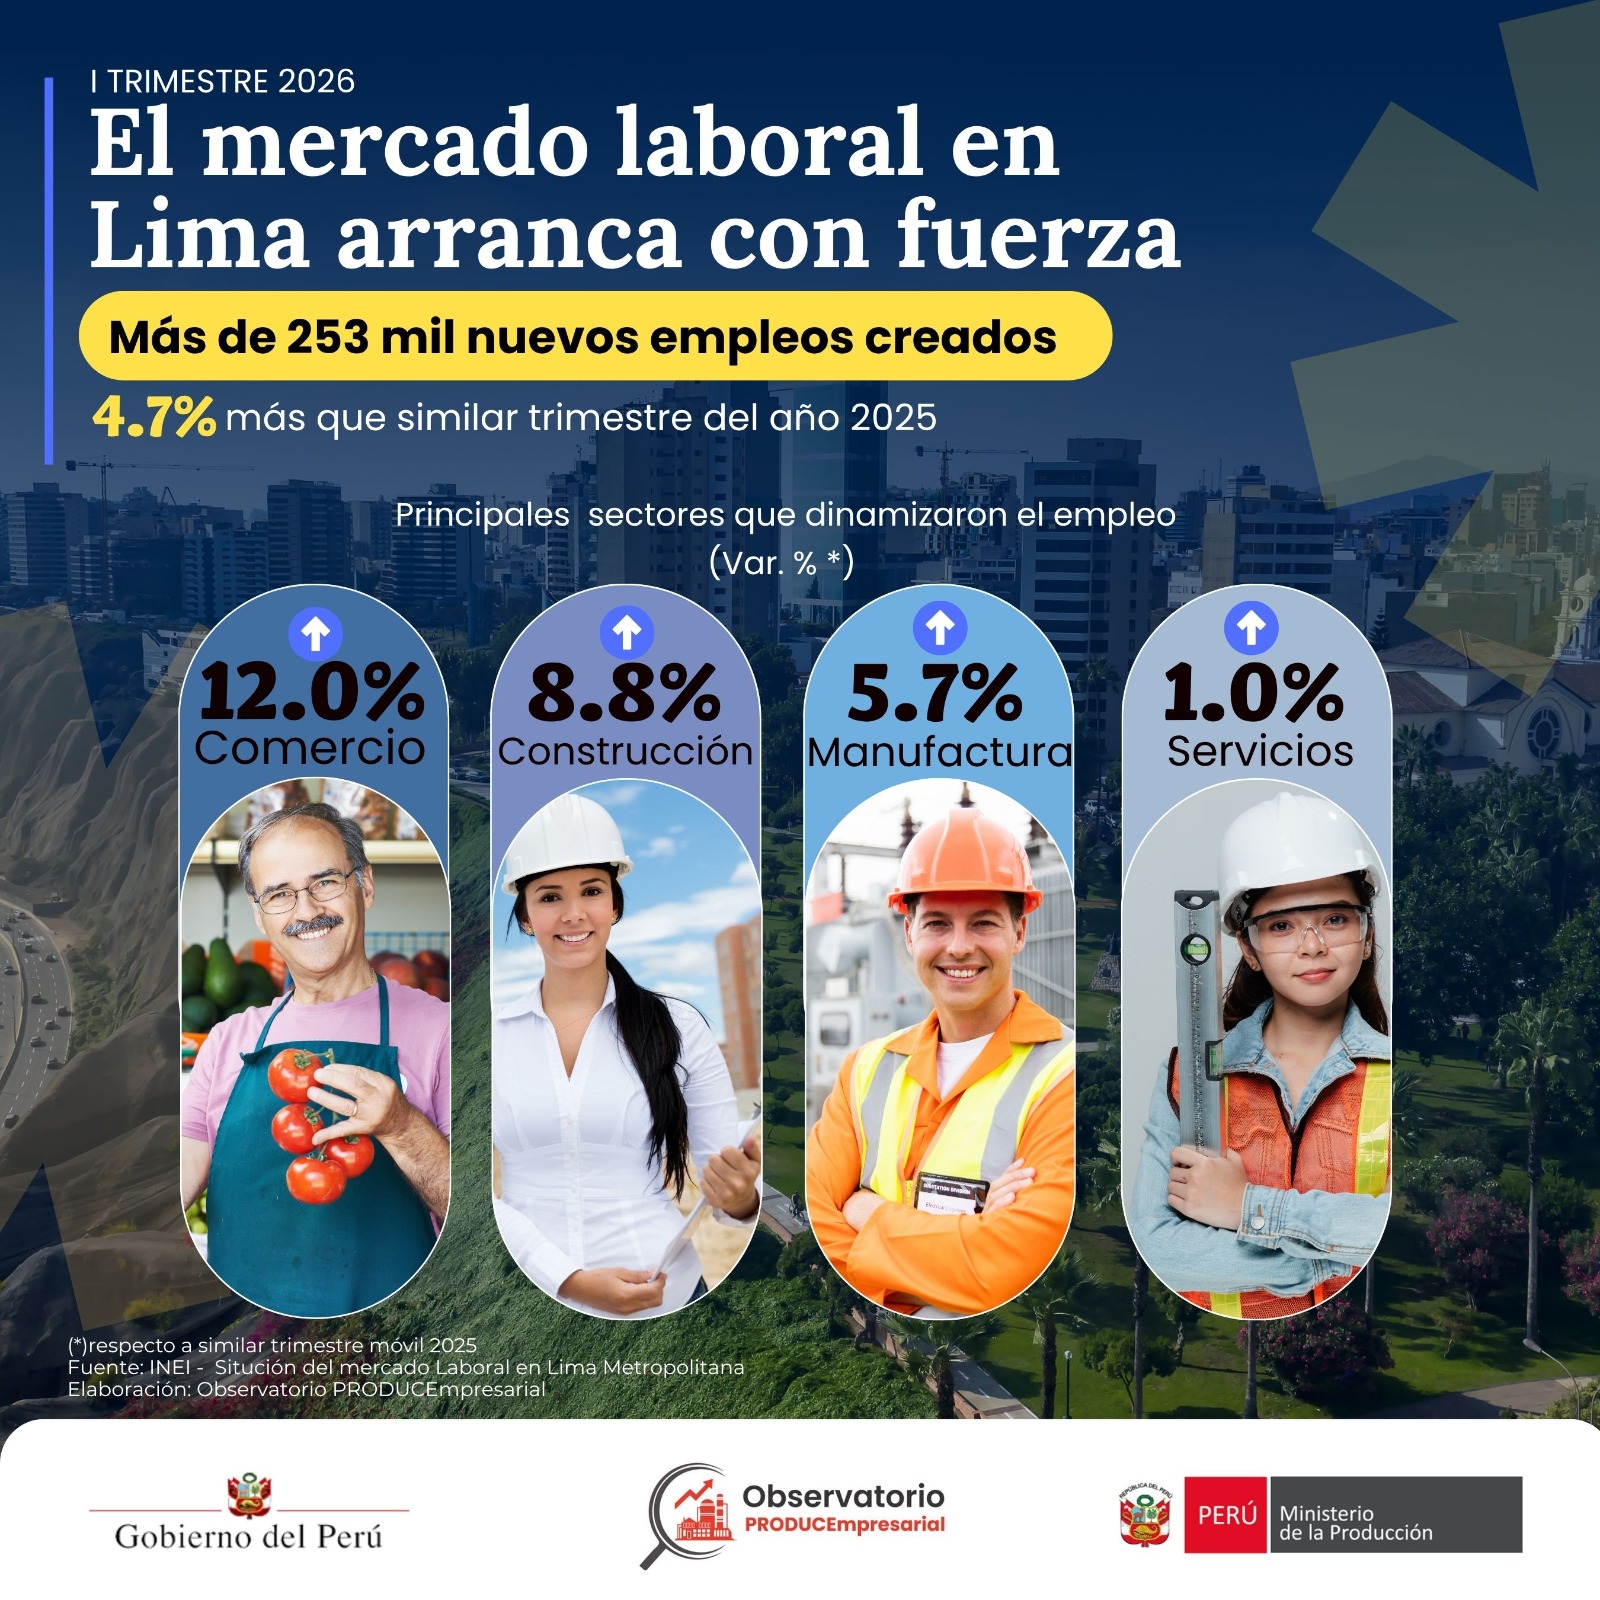
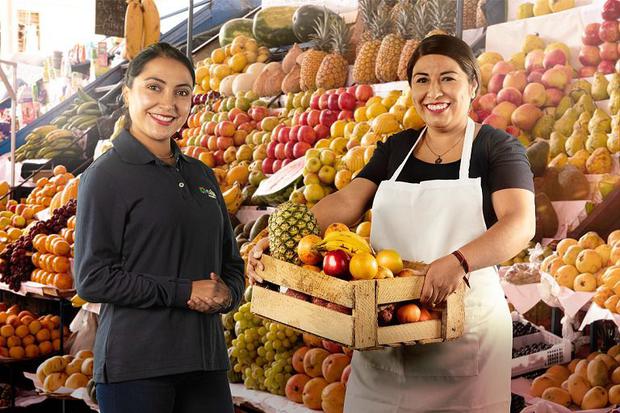
En febrero del 2026, las ventas del sector comercio interno registraron un crecimiento significativo de (+13.7%) en comparación con febrero de 2025. Este desempeño fue impulsado por
la campaña del Día de San Valentín y la Amistad, en un contexto de mayor dinamismo de la demanda interna (6.5%).
04
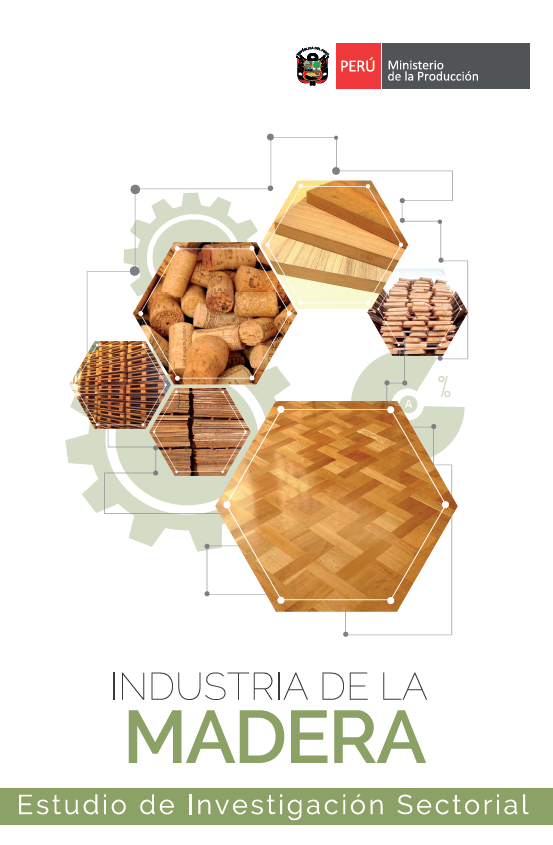
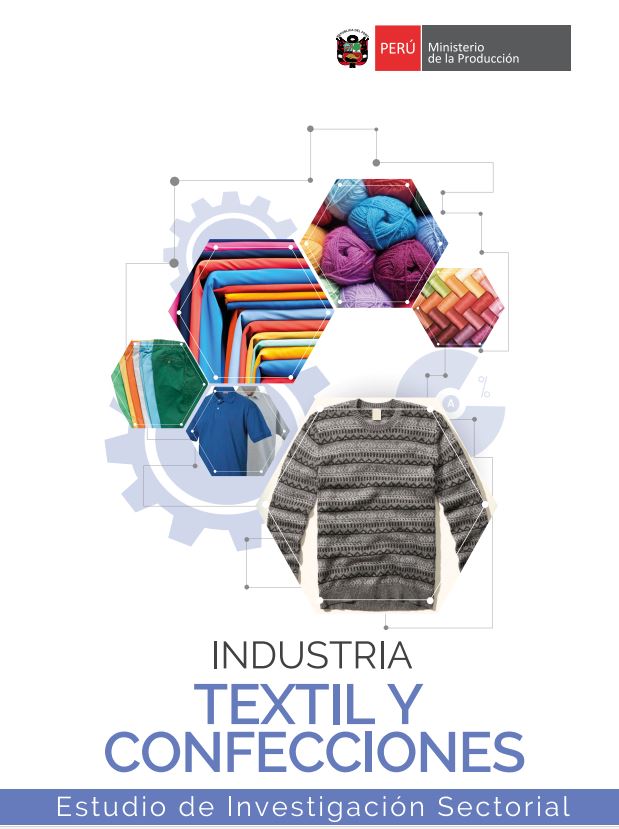
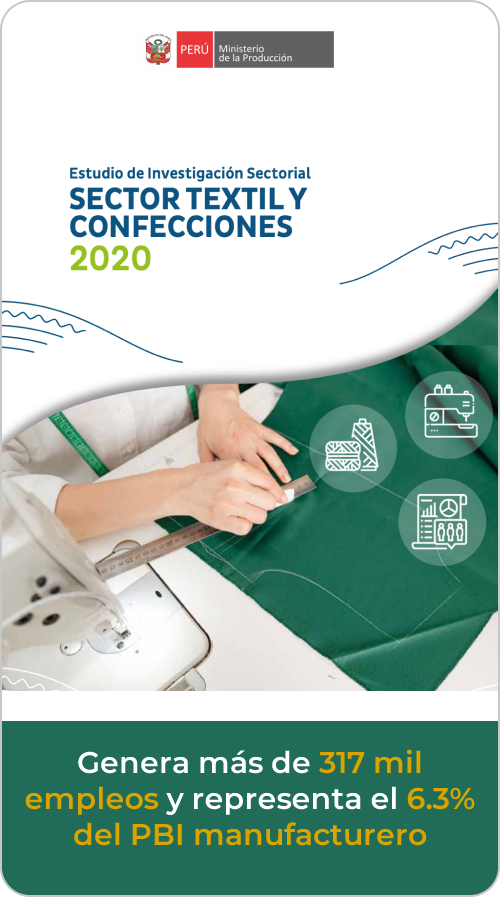
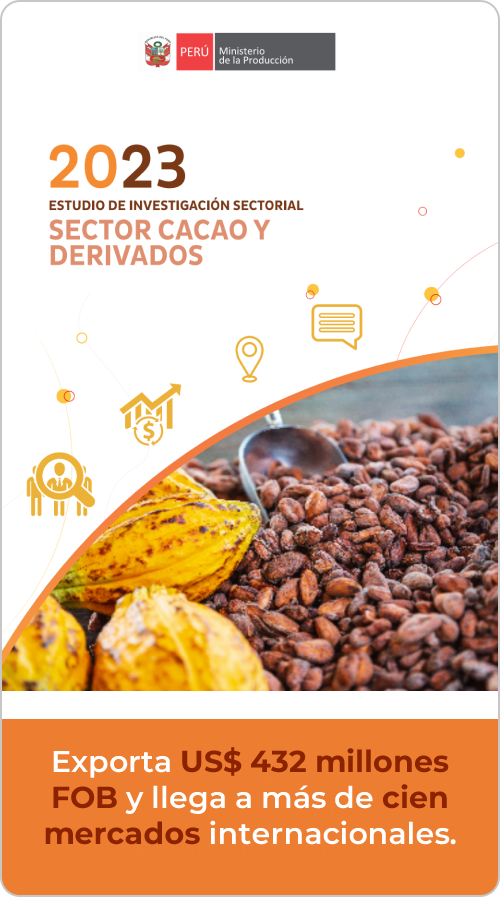
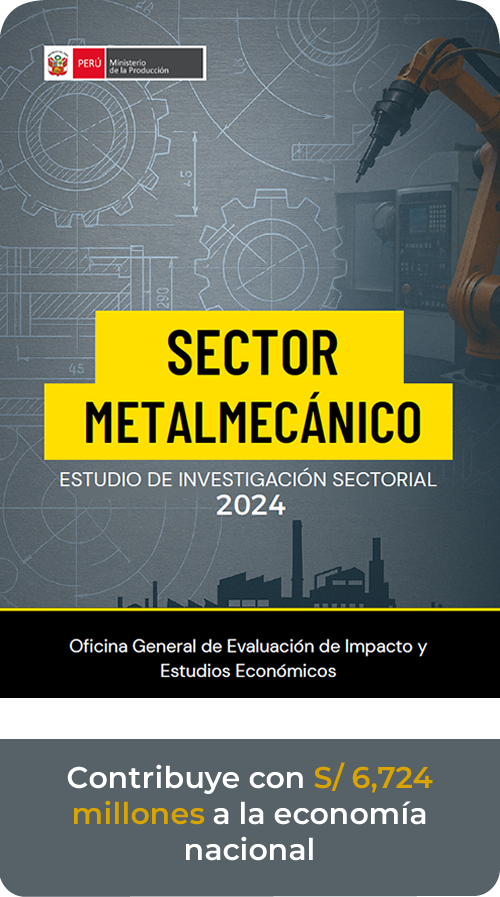
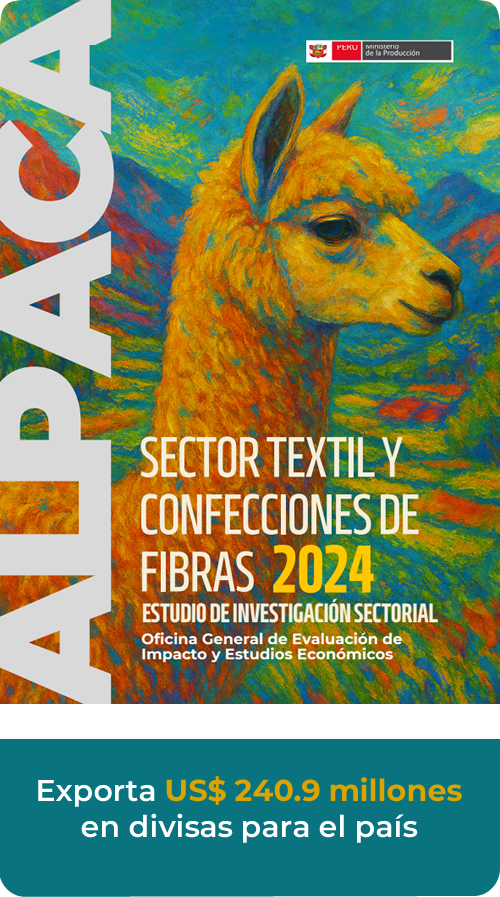
Sectoral Studies
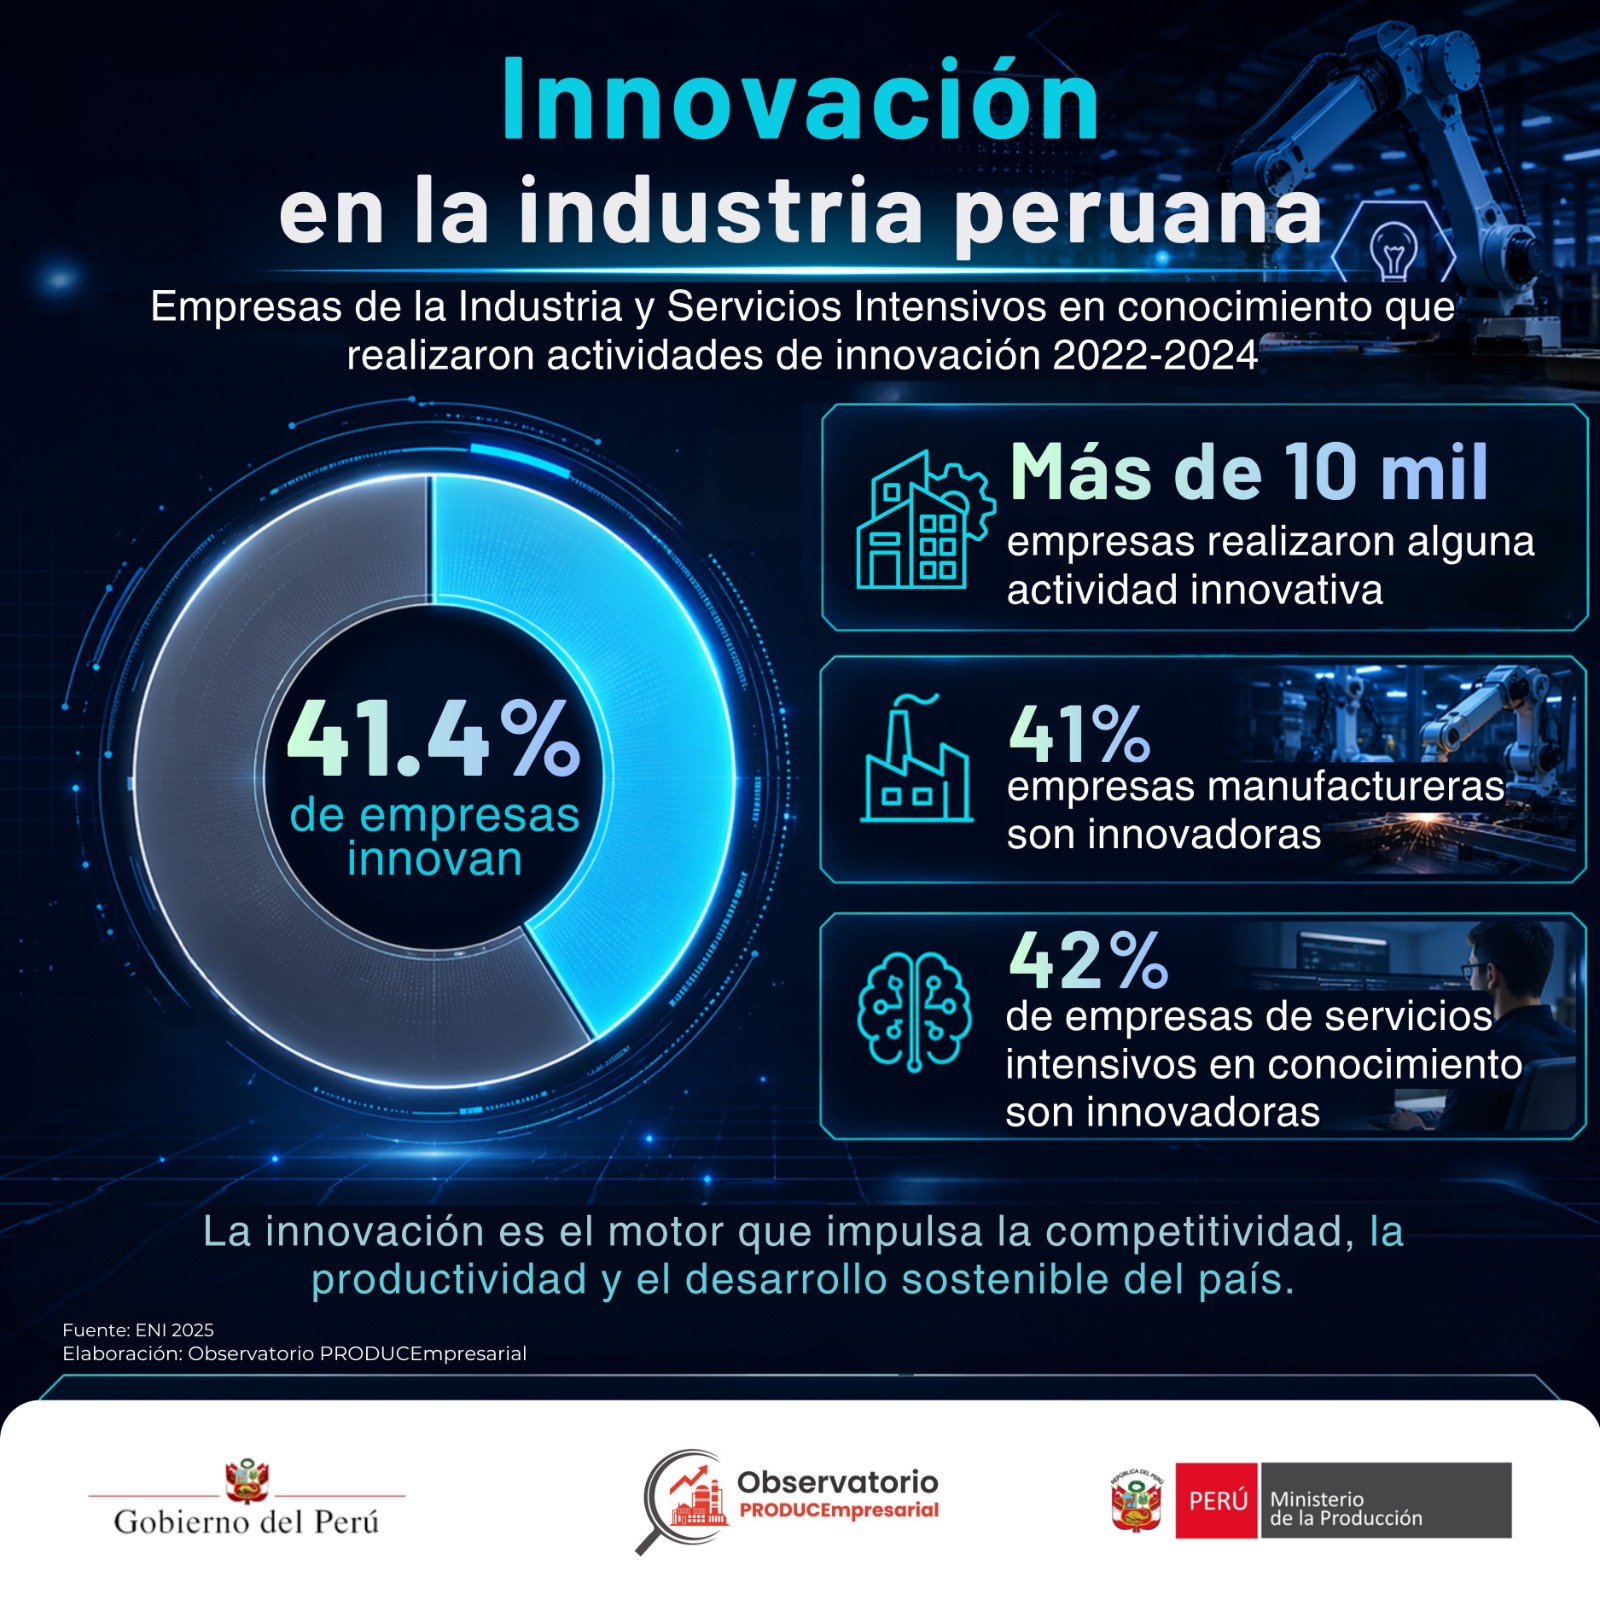
These sectoral studies analyze the performance of an industry at an economic and statistical level, evaluating key indicators such as GDP, employment, and innovation. They are essential for strategic decision-making and the design of policies that promote sectoral growth. We invite you to review them!
05

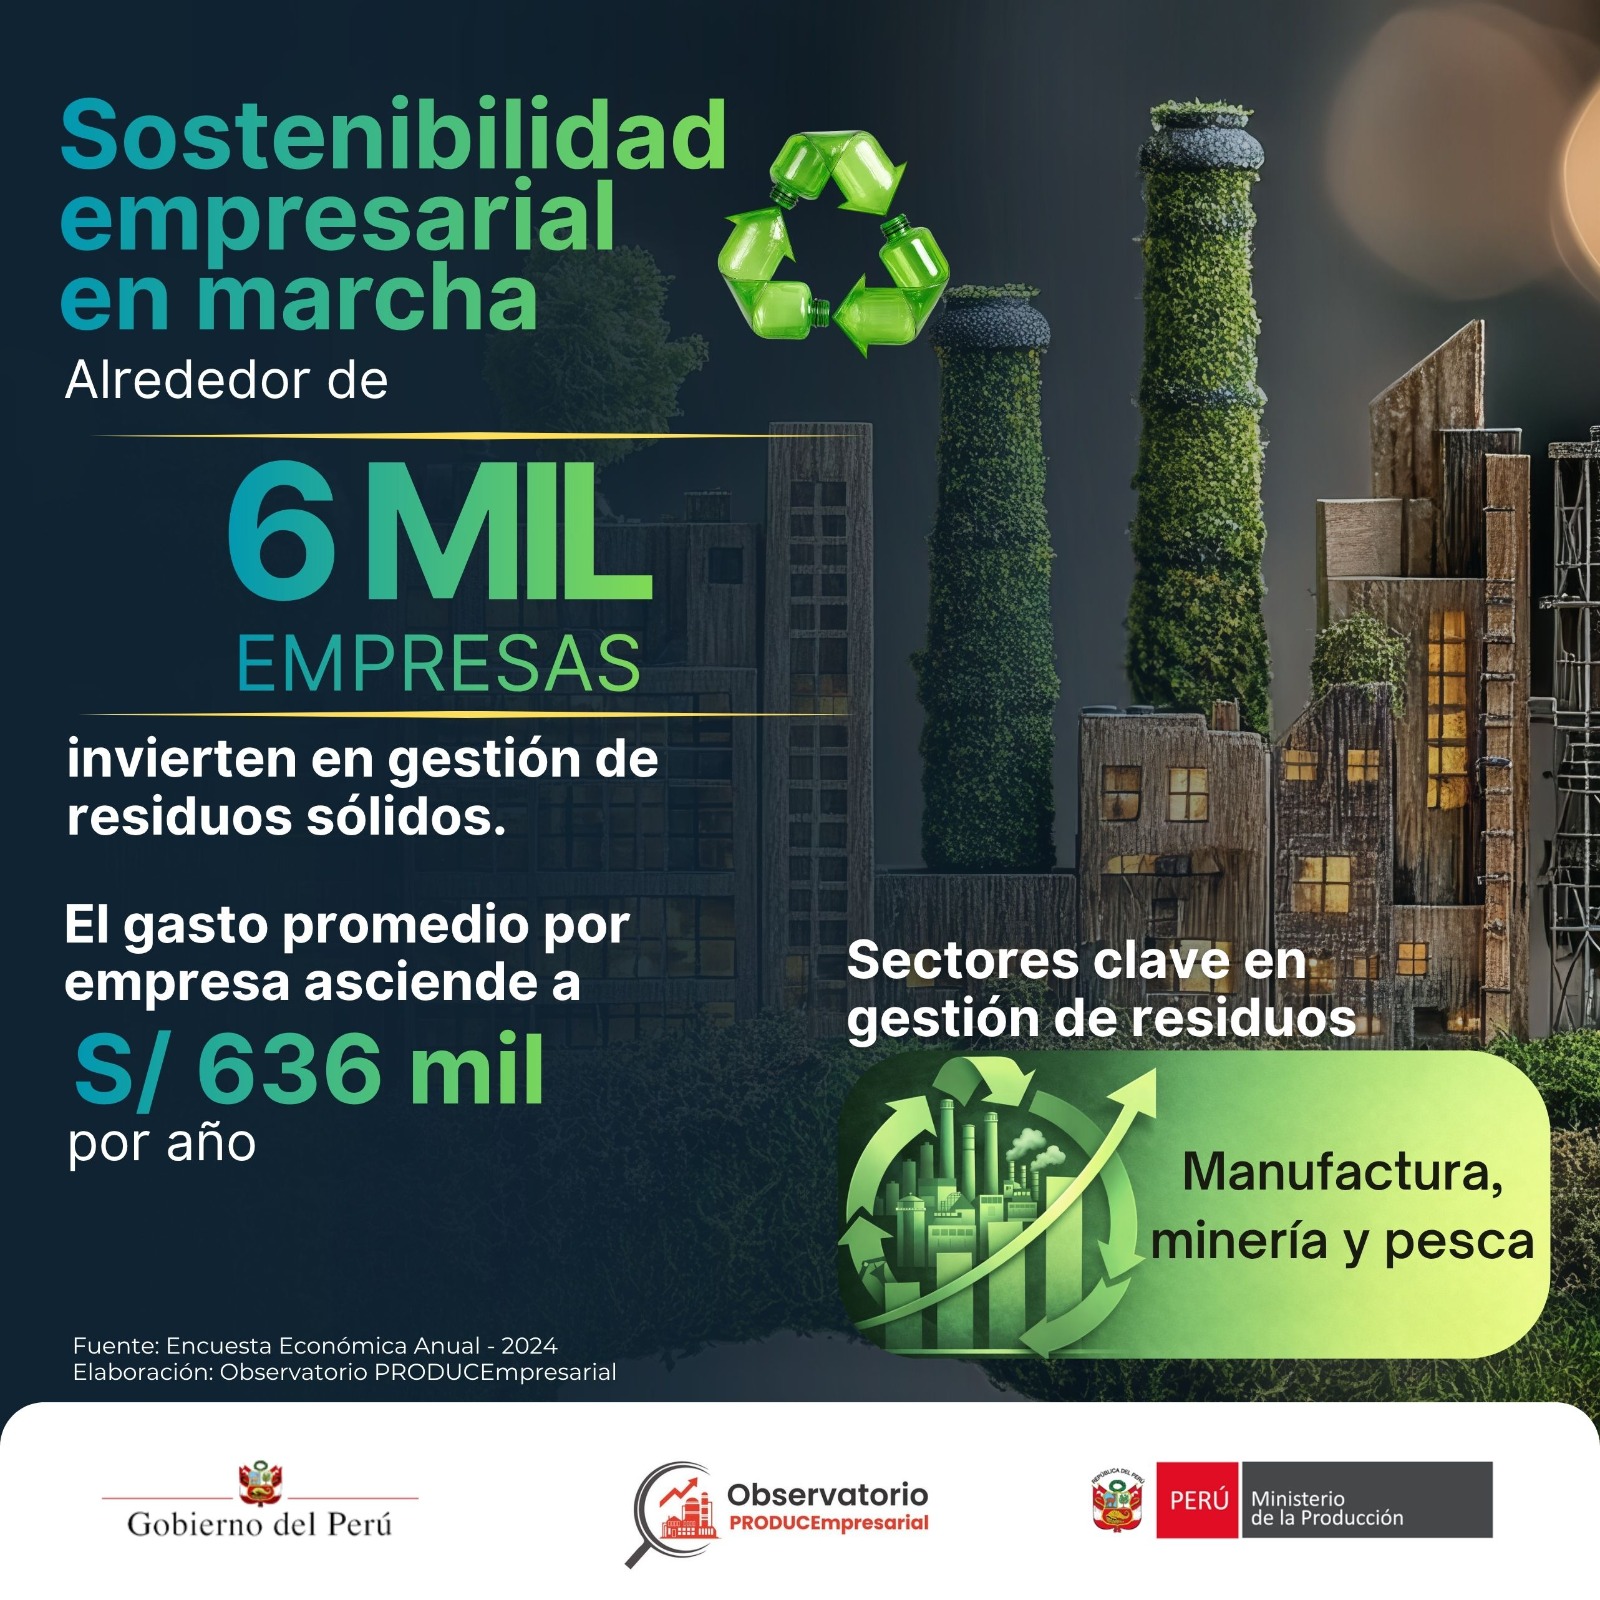
Circular Economy
More than 43 thousand companies nationwide implemented actions in favor of the environment.
Circular Economy
More than 50% of medium and large industrial companies that invest in environmental protection prioritize wastewater and waste management.

Compartir en:

Compartir en:
Compartir en:
Compartir en:
Compartir en:
Compartir en:
Compartir en:
Compartir en:
Compartir en:
Compartir en:
Compartir en:
Compartir en:
Compartir en:
Compartir en:
Compartir en:
Compartir en:
Compartir en:
Compartir en:
Compartir en:
Compartir en:
Compartir en:
Compartir en:
Compartir en:
Compartir en:
Compartir en:
Compartir en:
Compartir en:
Compartir en:
Compartir en:
Compartir en:
Compartir en:
Compartir en:
Compartir en:
Compartir en:
Compartir en:
Compartir en:
Compartir en:
Compartir en:
Compartir en:
Compartir en:
Compartir en:
Compartir en:
Compartir en:
Compartir en:
Compartir en:
Compartir en:
Compartir en:
Compartir en:
Compartir en:
Compartir en:
Compartir en:
Compartir en:
Compartir en:
Compartir en:
Compartir en:
Compartir en:
Compartir en:
Compartir en:
Compartir en:

Compartir en:
Compartir en:
Compartir en:
Compartir en:
Compartir en:
Compartir en:
Compartir en:
Compartir en:
Compartir en:
Compartir en:
Compartir en:
Compartir en:
Compartir en:
Compartir en:
Compartir en:
Compartir en:
Compartir en:
Compartir en:
Compartir en:
Compartir en:
Compartir en:
Compartir en:
Compartir en:
Compartir en:
Compartir en:
Compartir en:
Compartir en:
Compartir en:
Compartir en:
Compartir en:
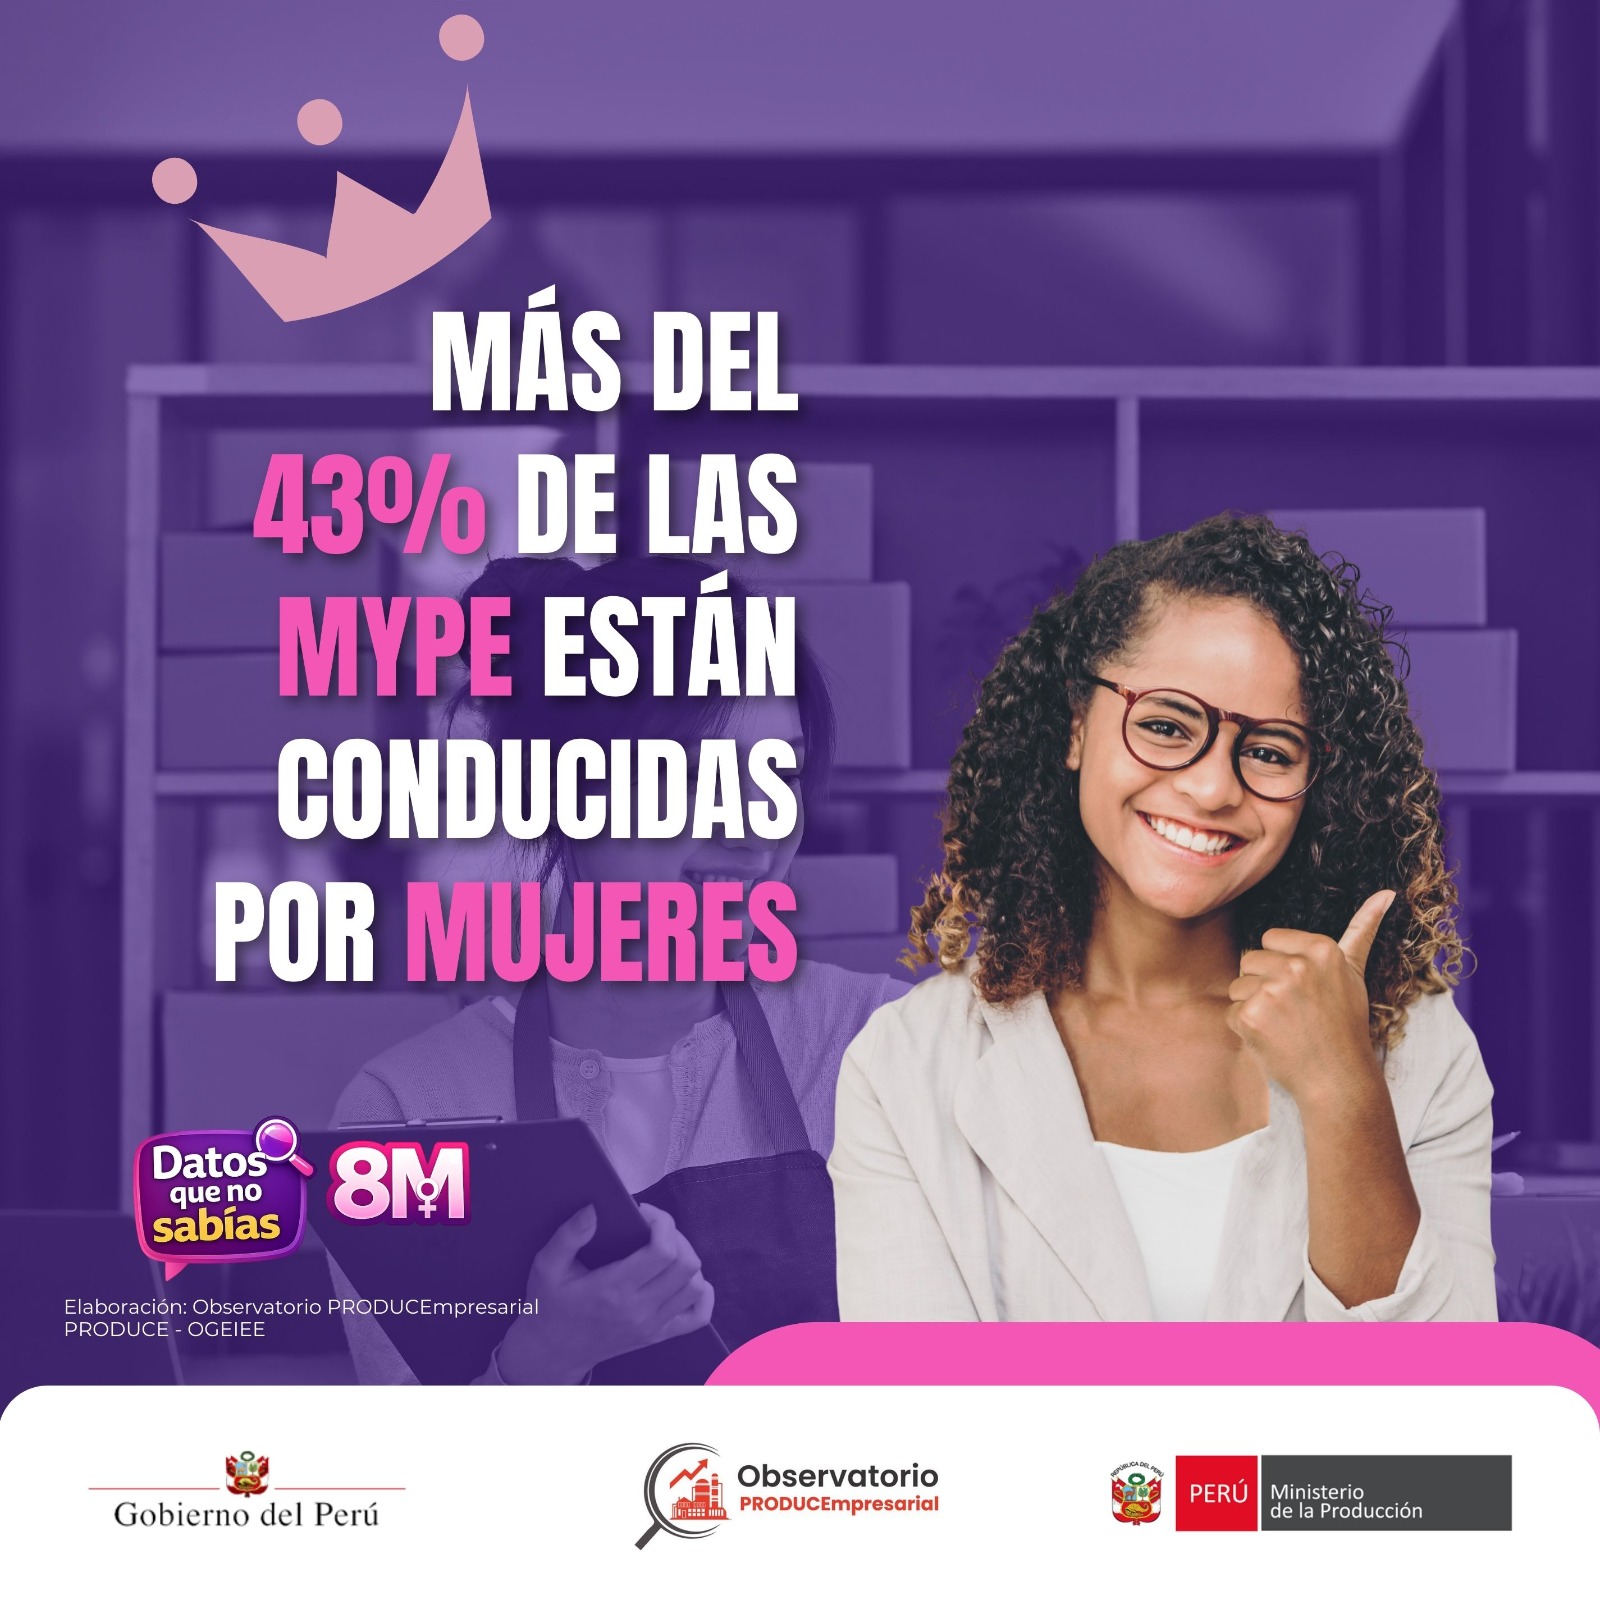
1 033 844
Companies are led by women

99.5%
Are MSEs
52.1%
work in the retail sector
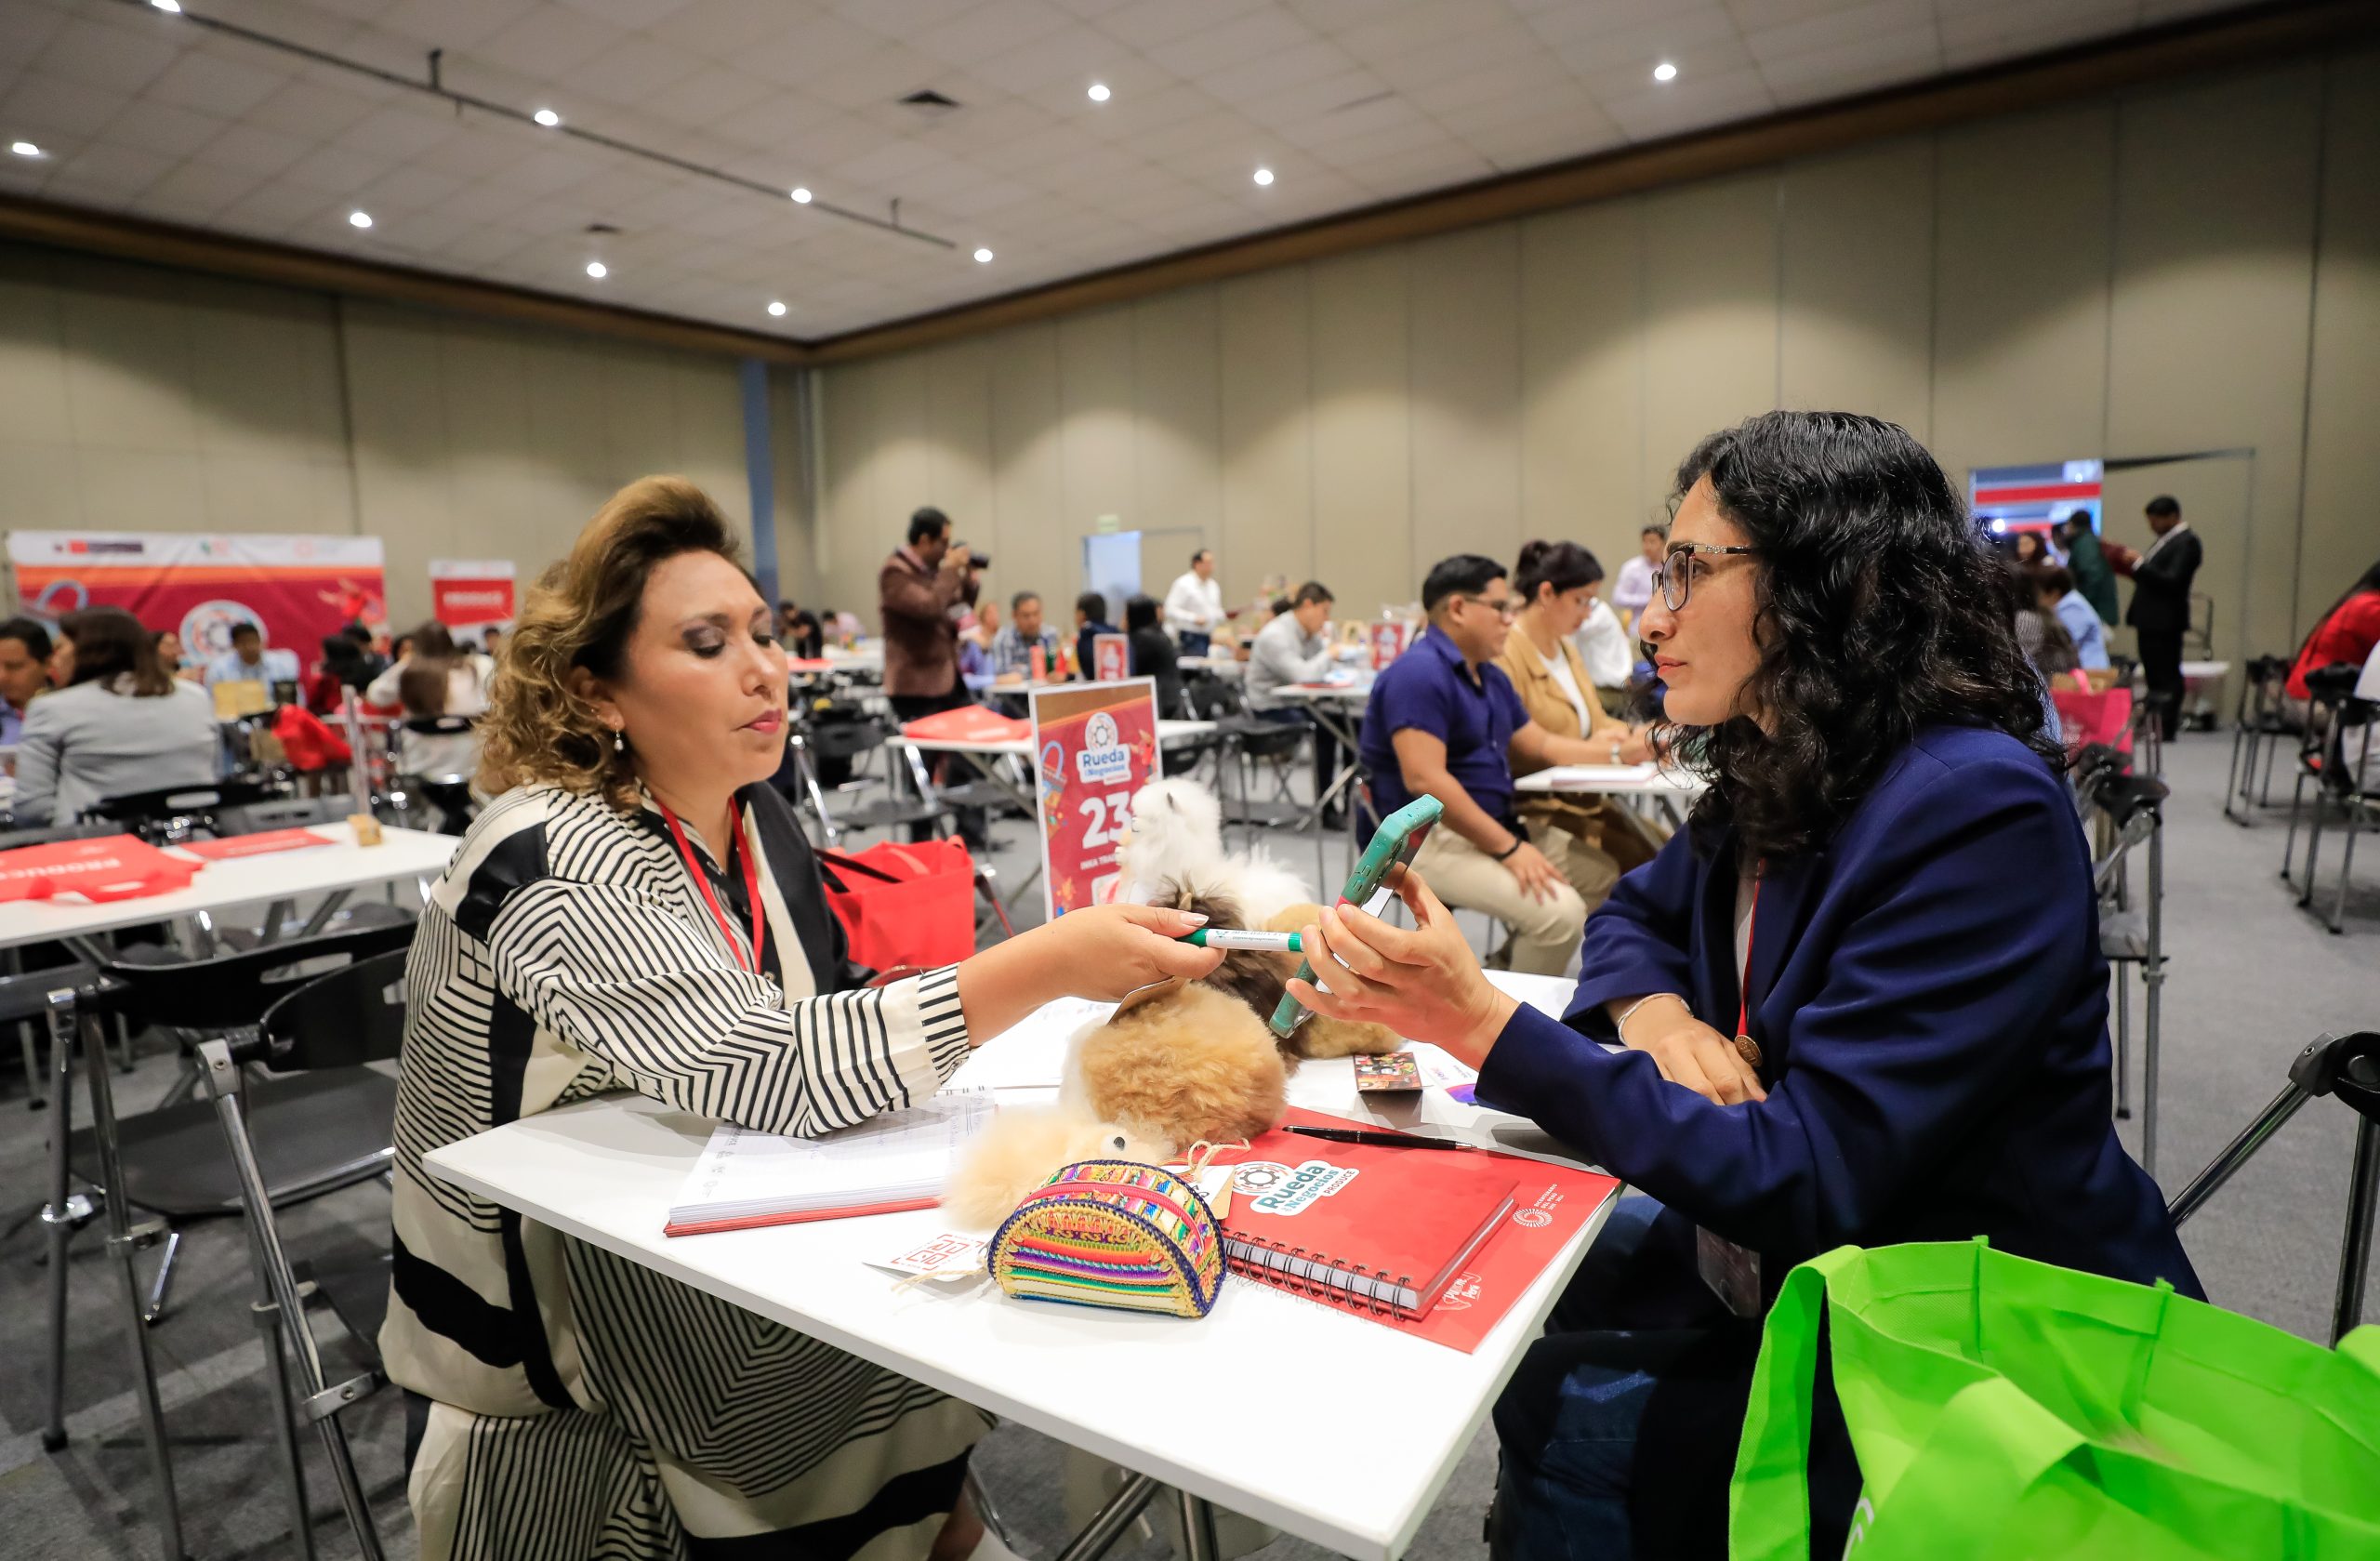
37.8%
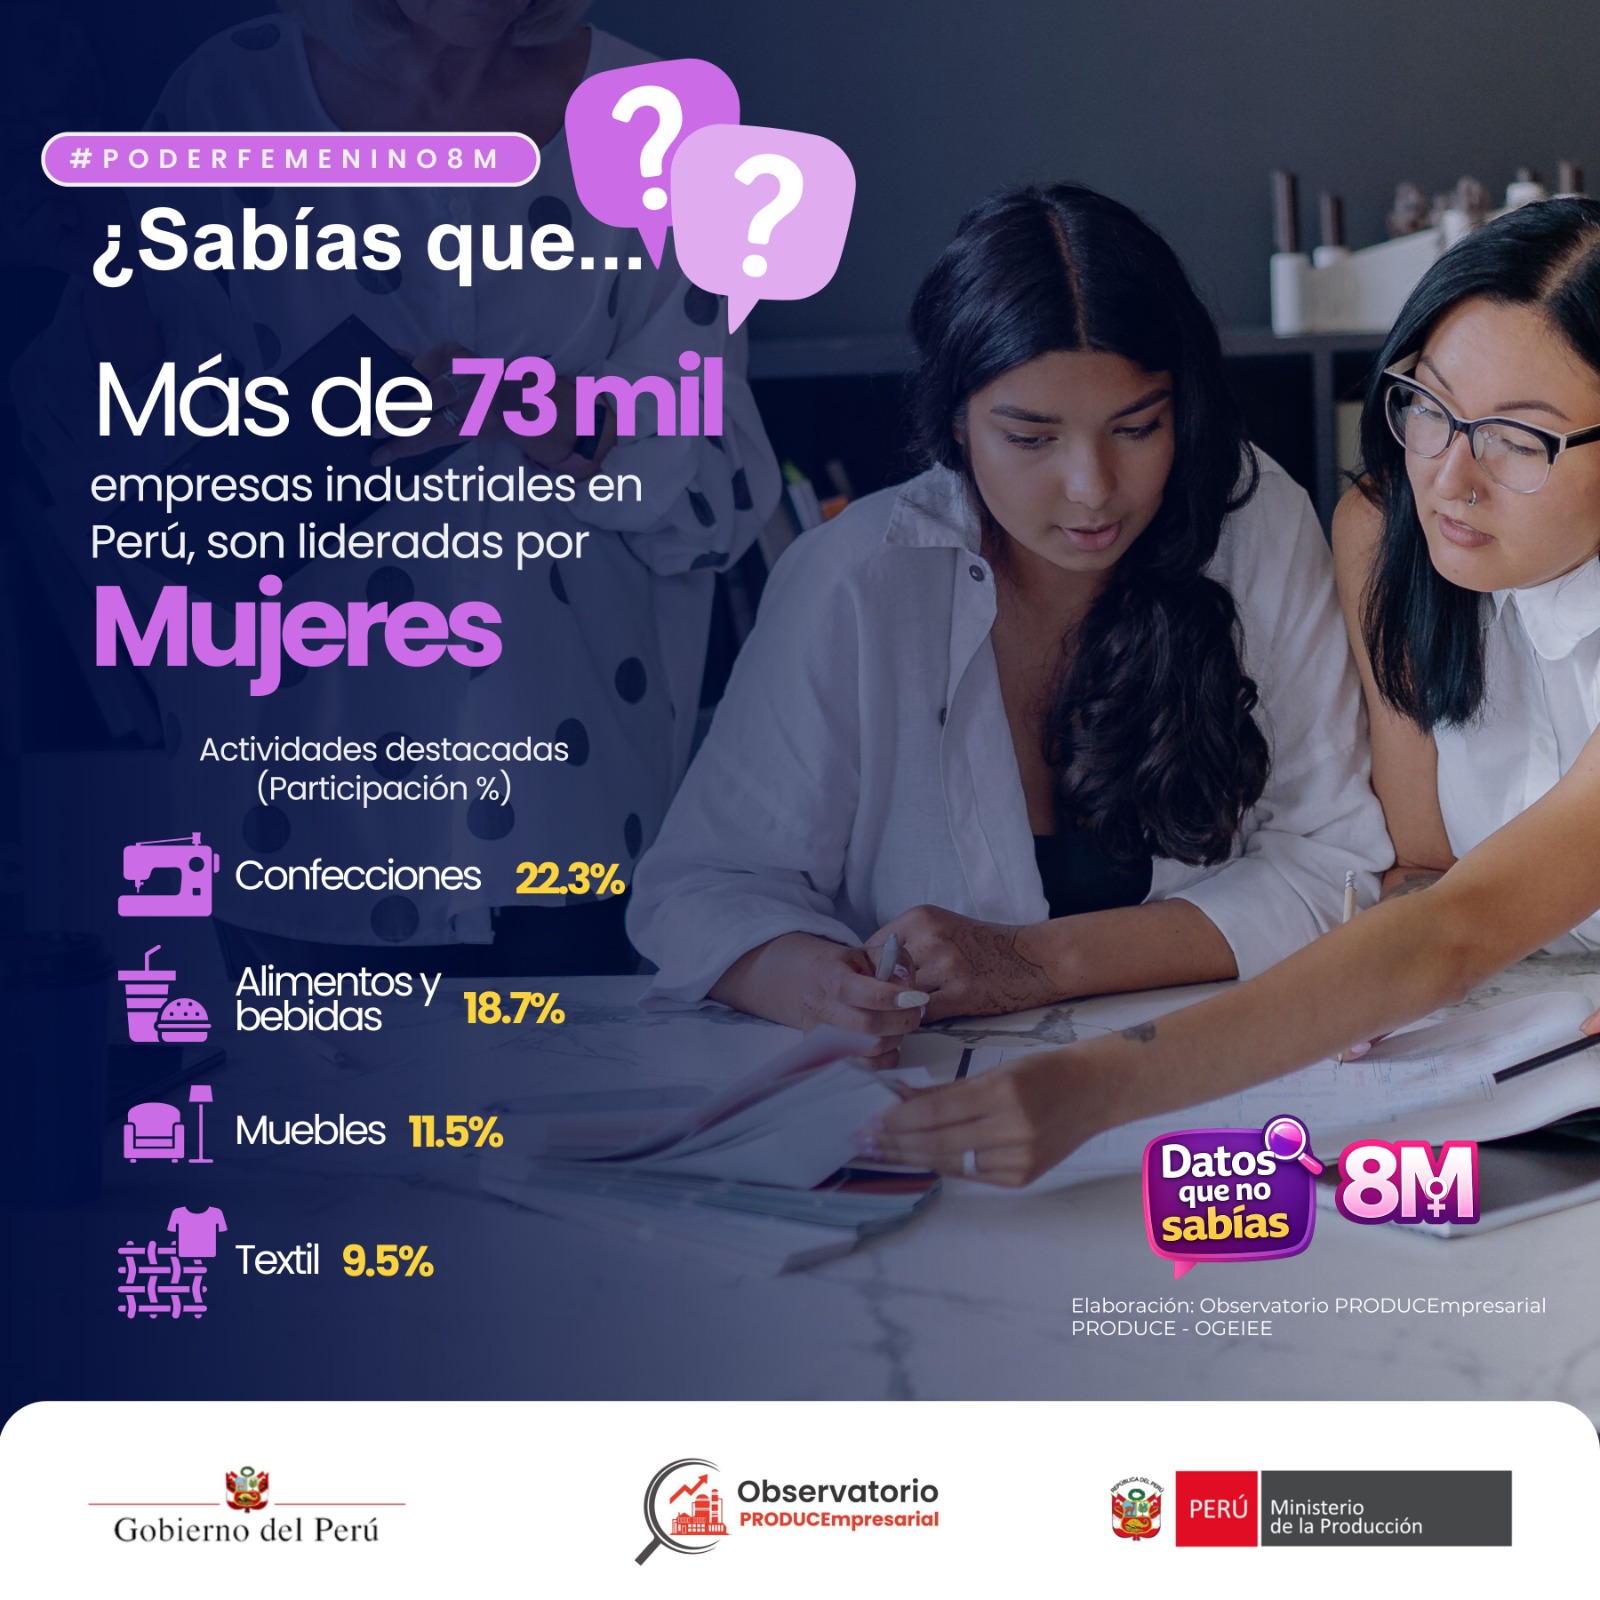
Work in the services sector and to 7% in manufacture sector


Download our databases

Download our surveys

Download our censuses
![]()
CONTACT US
Telephone:
(511) 616 2222
Annex: 3357
E-mail
producempresarial@produce.gob.pe