Compartir en:
Manufacturing industry
january 2026
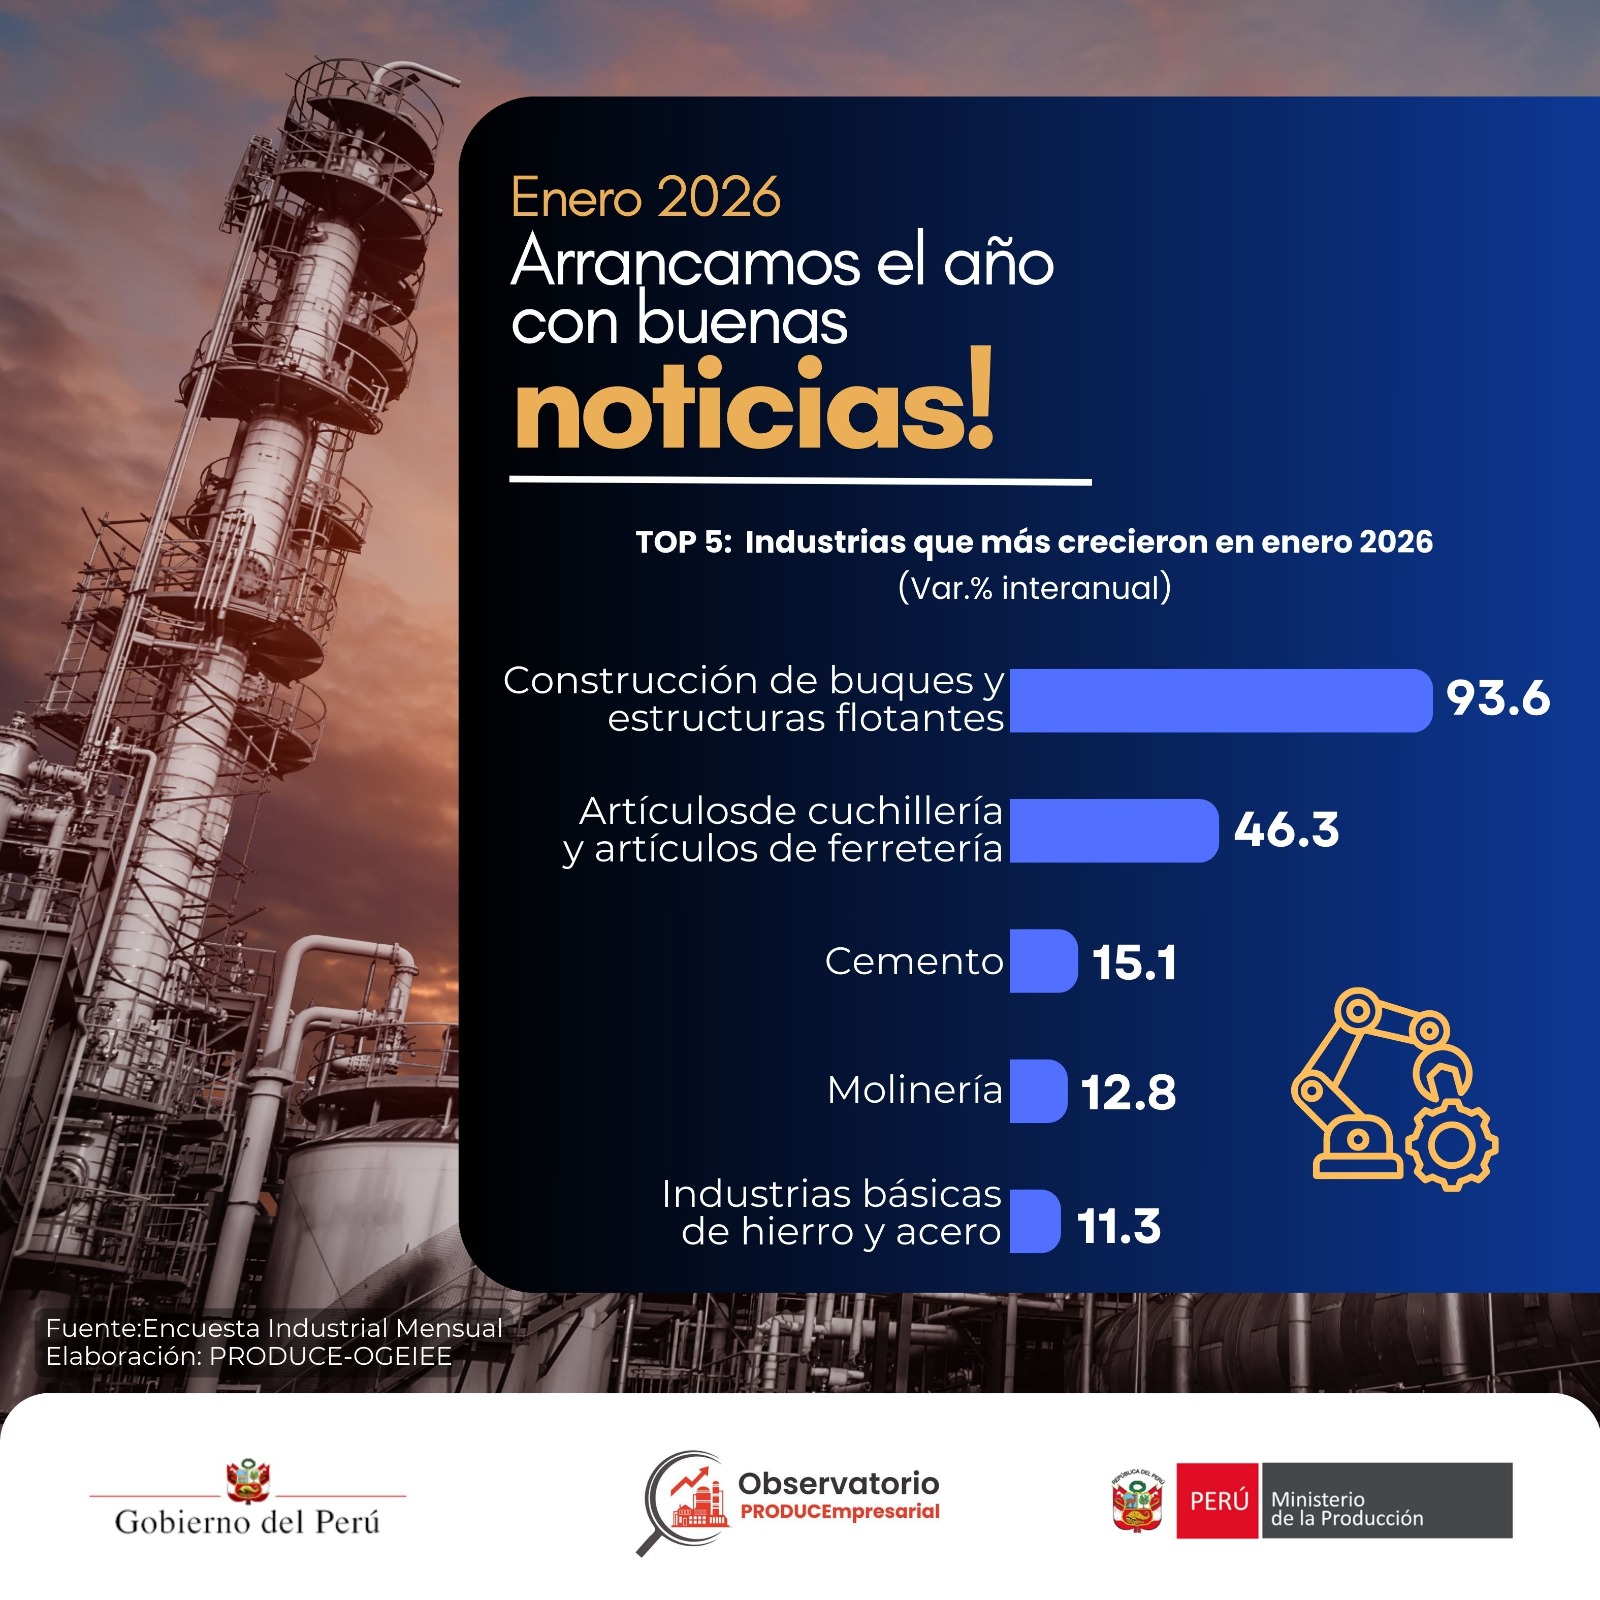
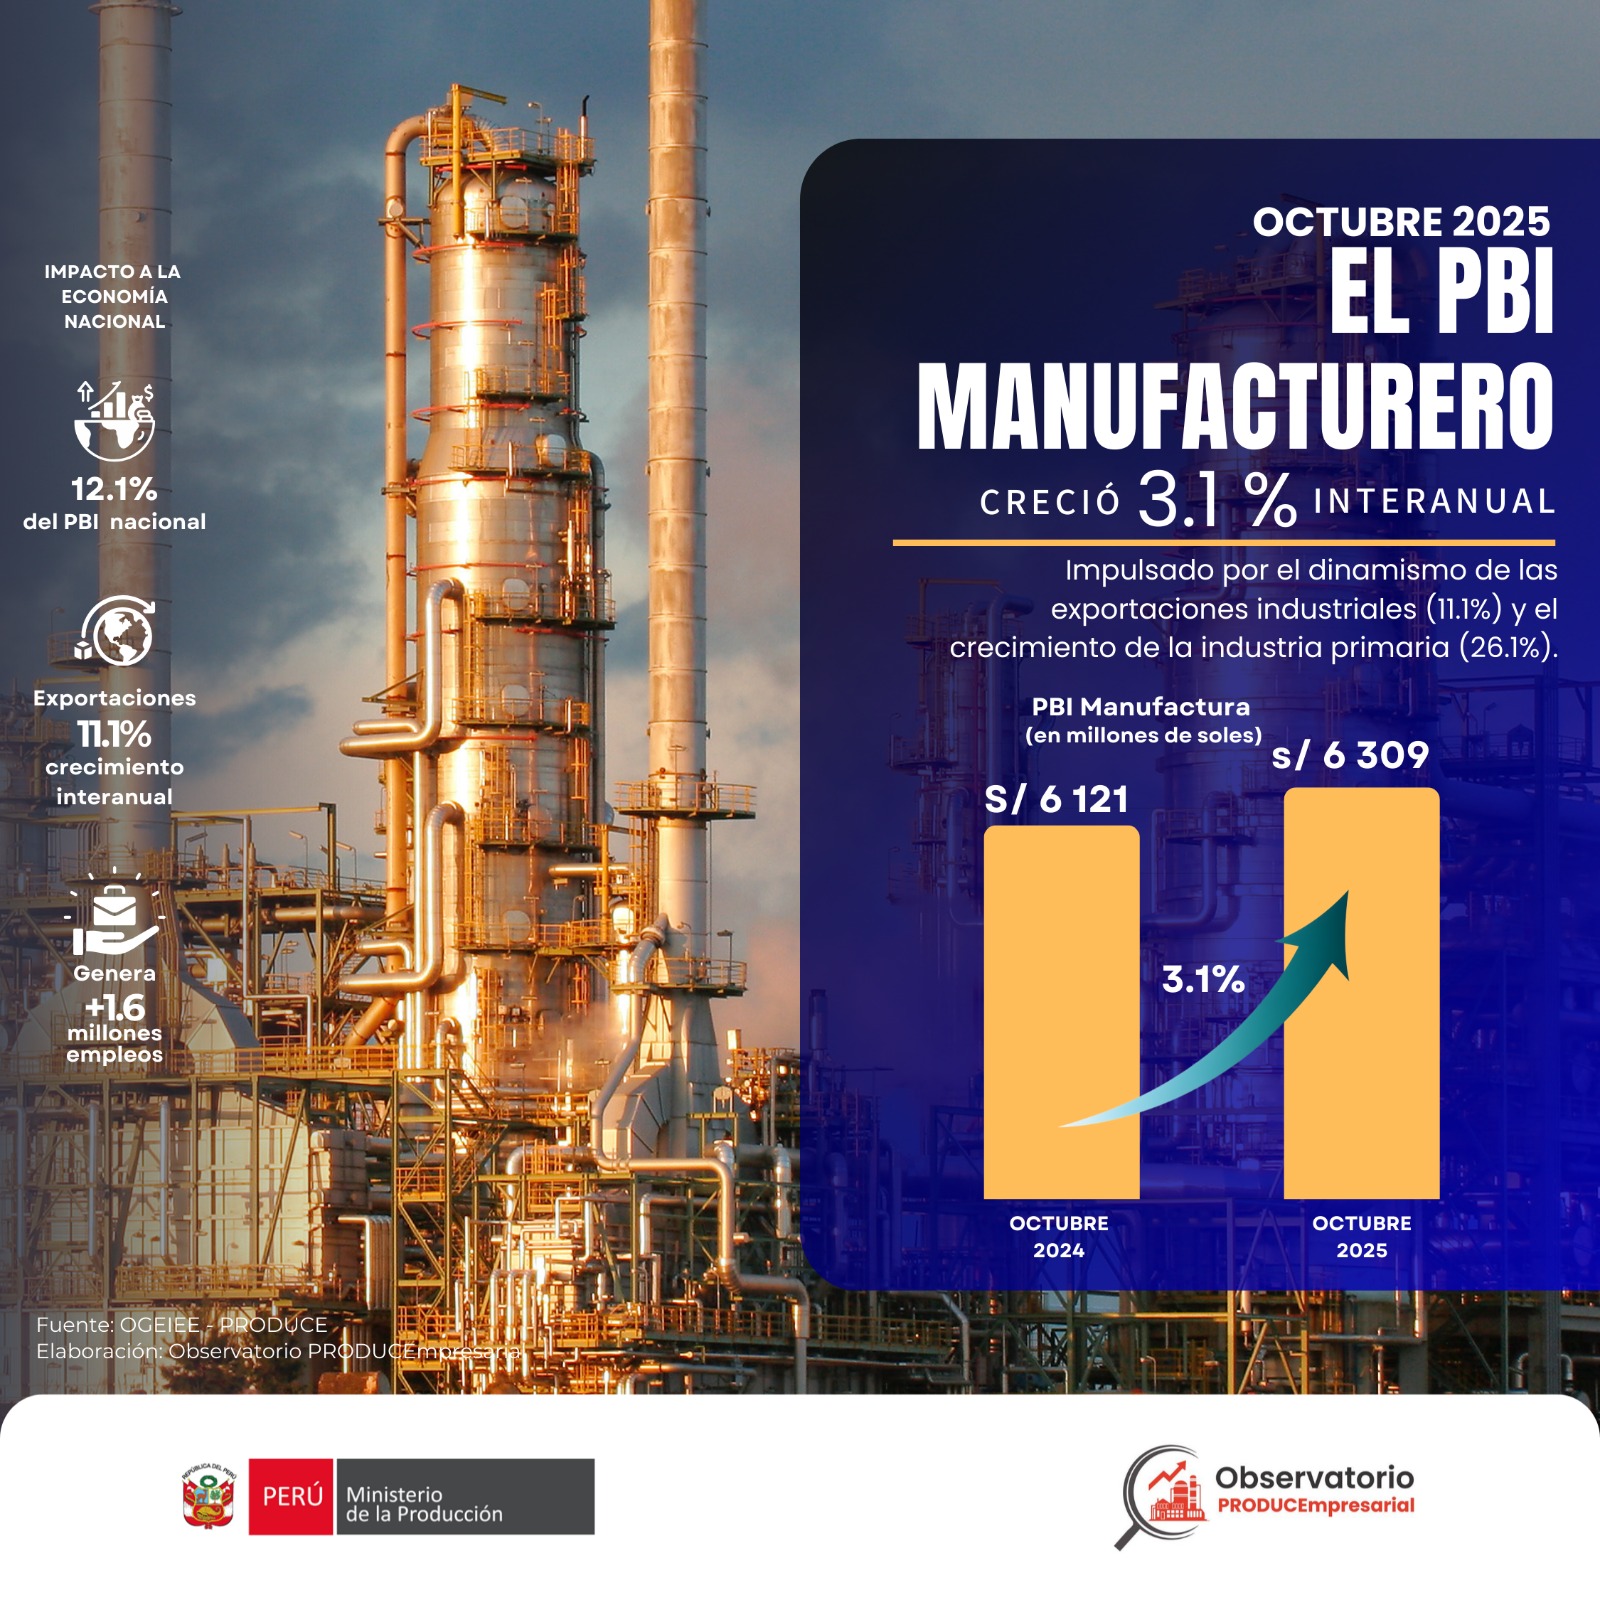
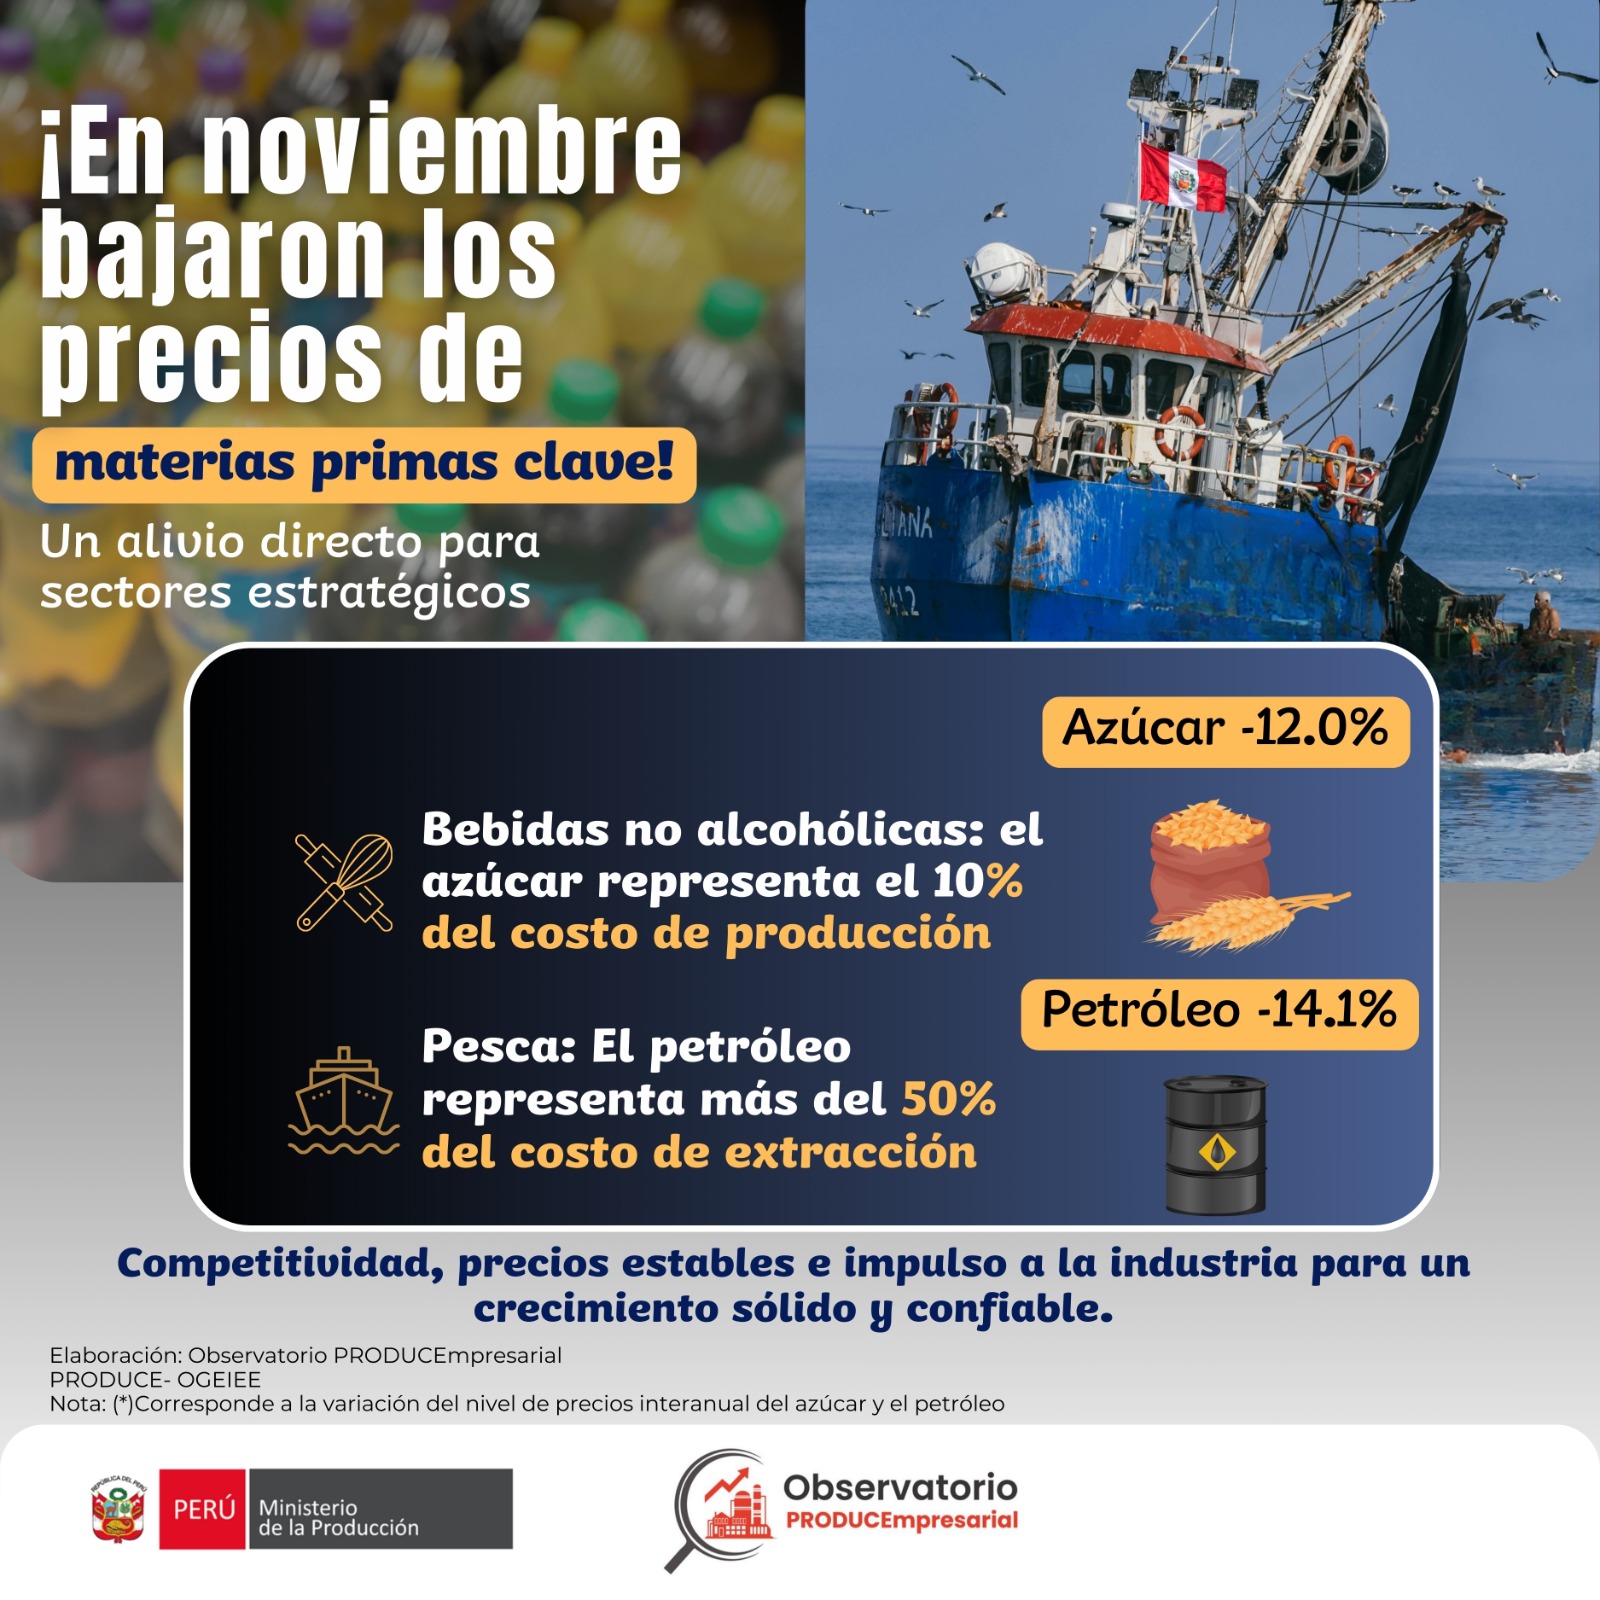
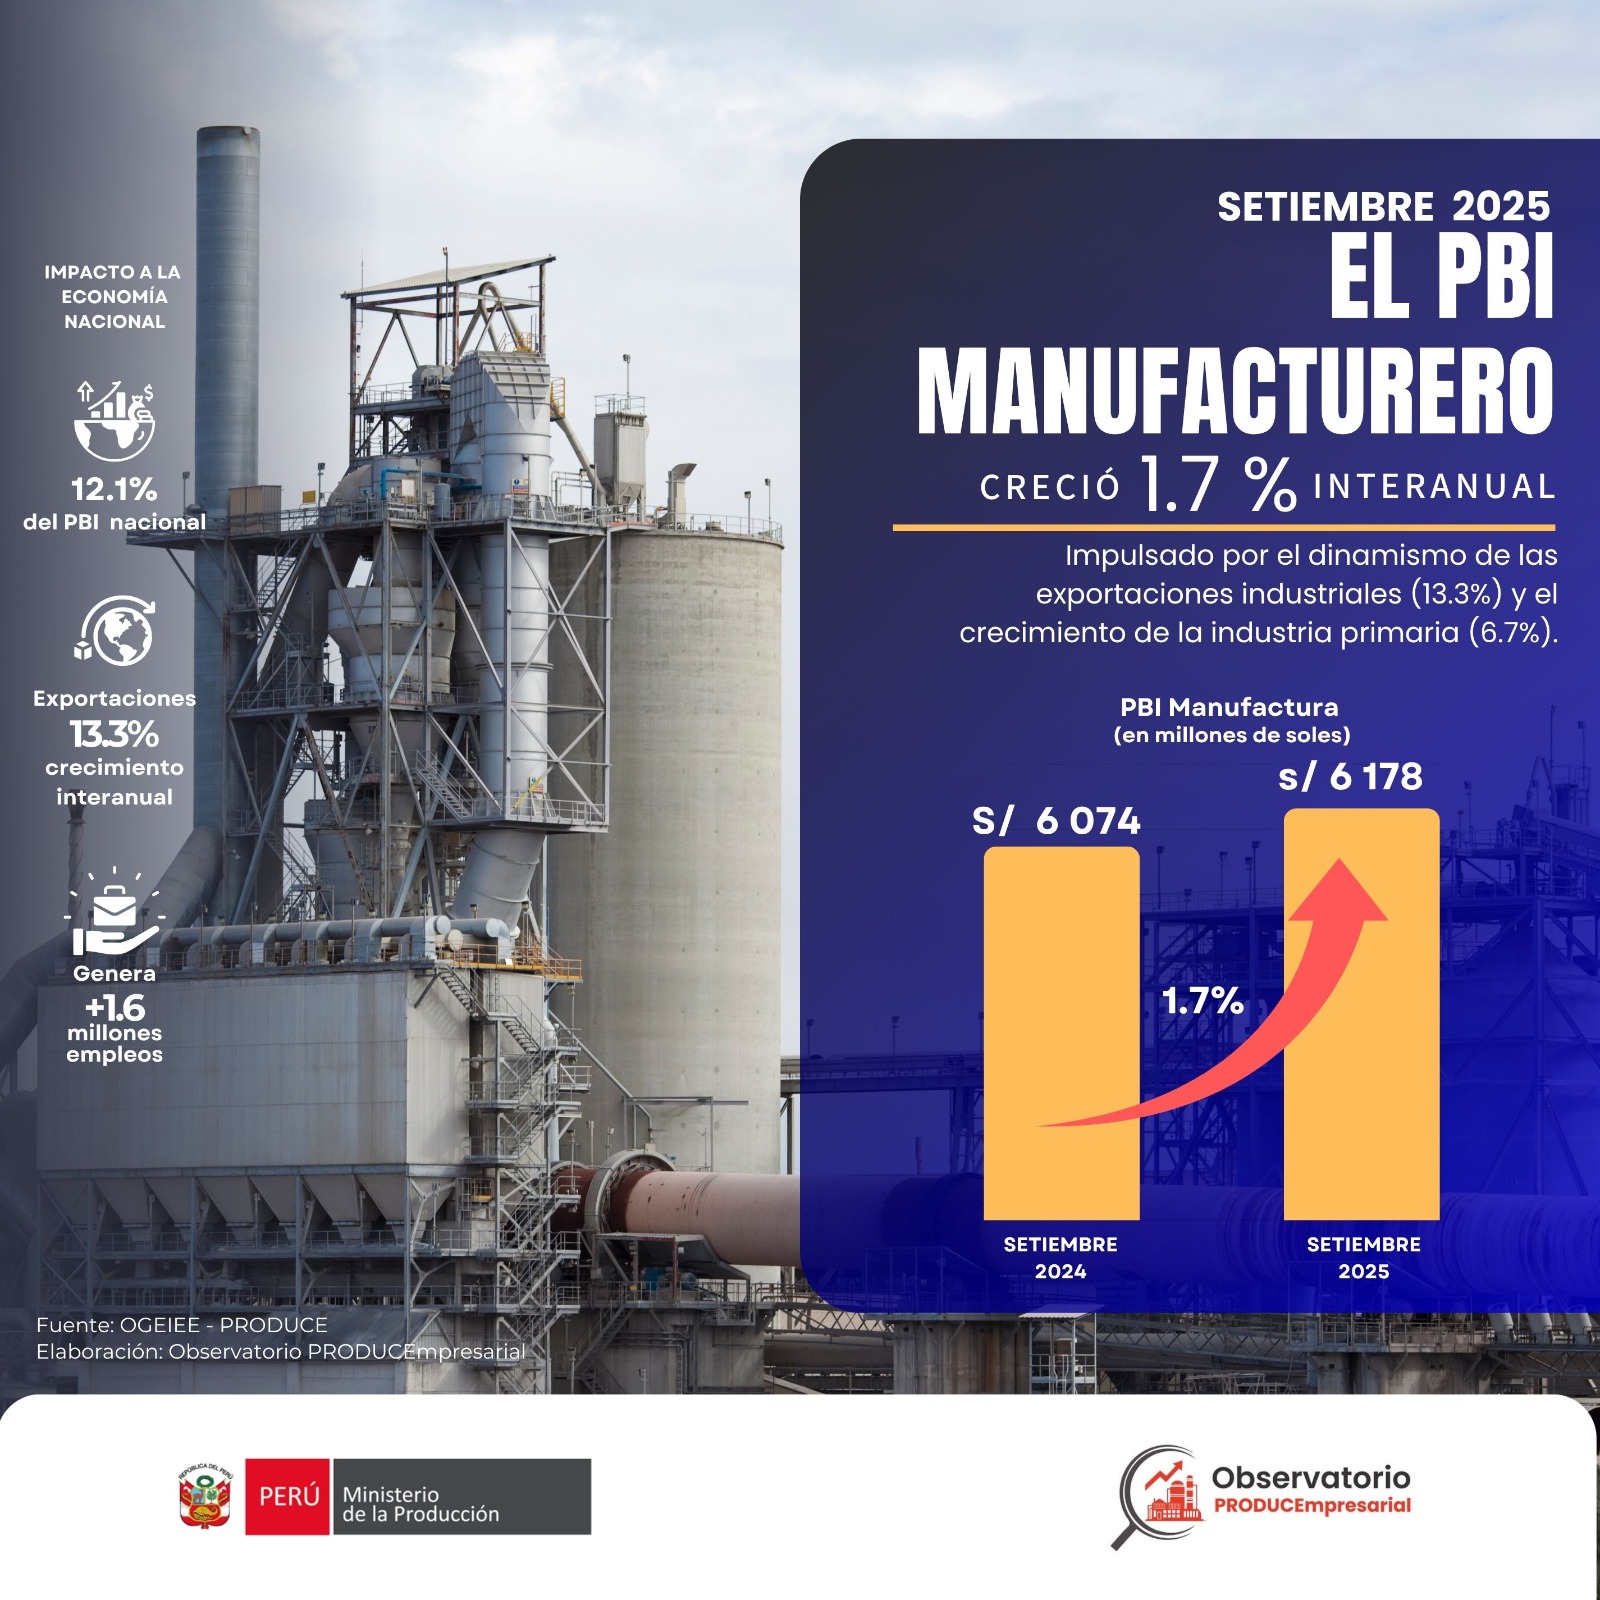
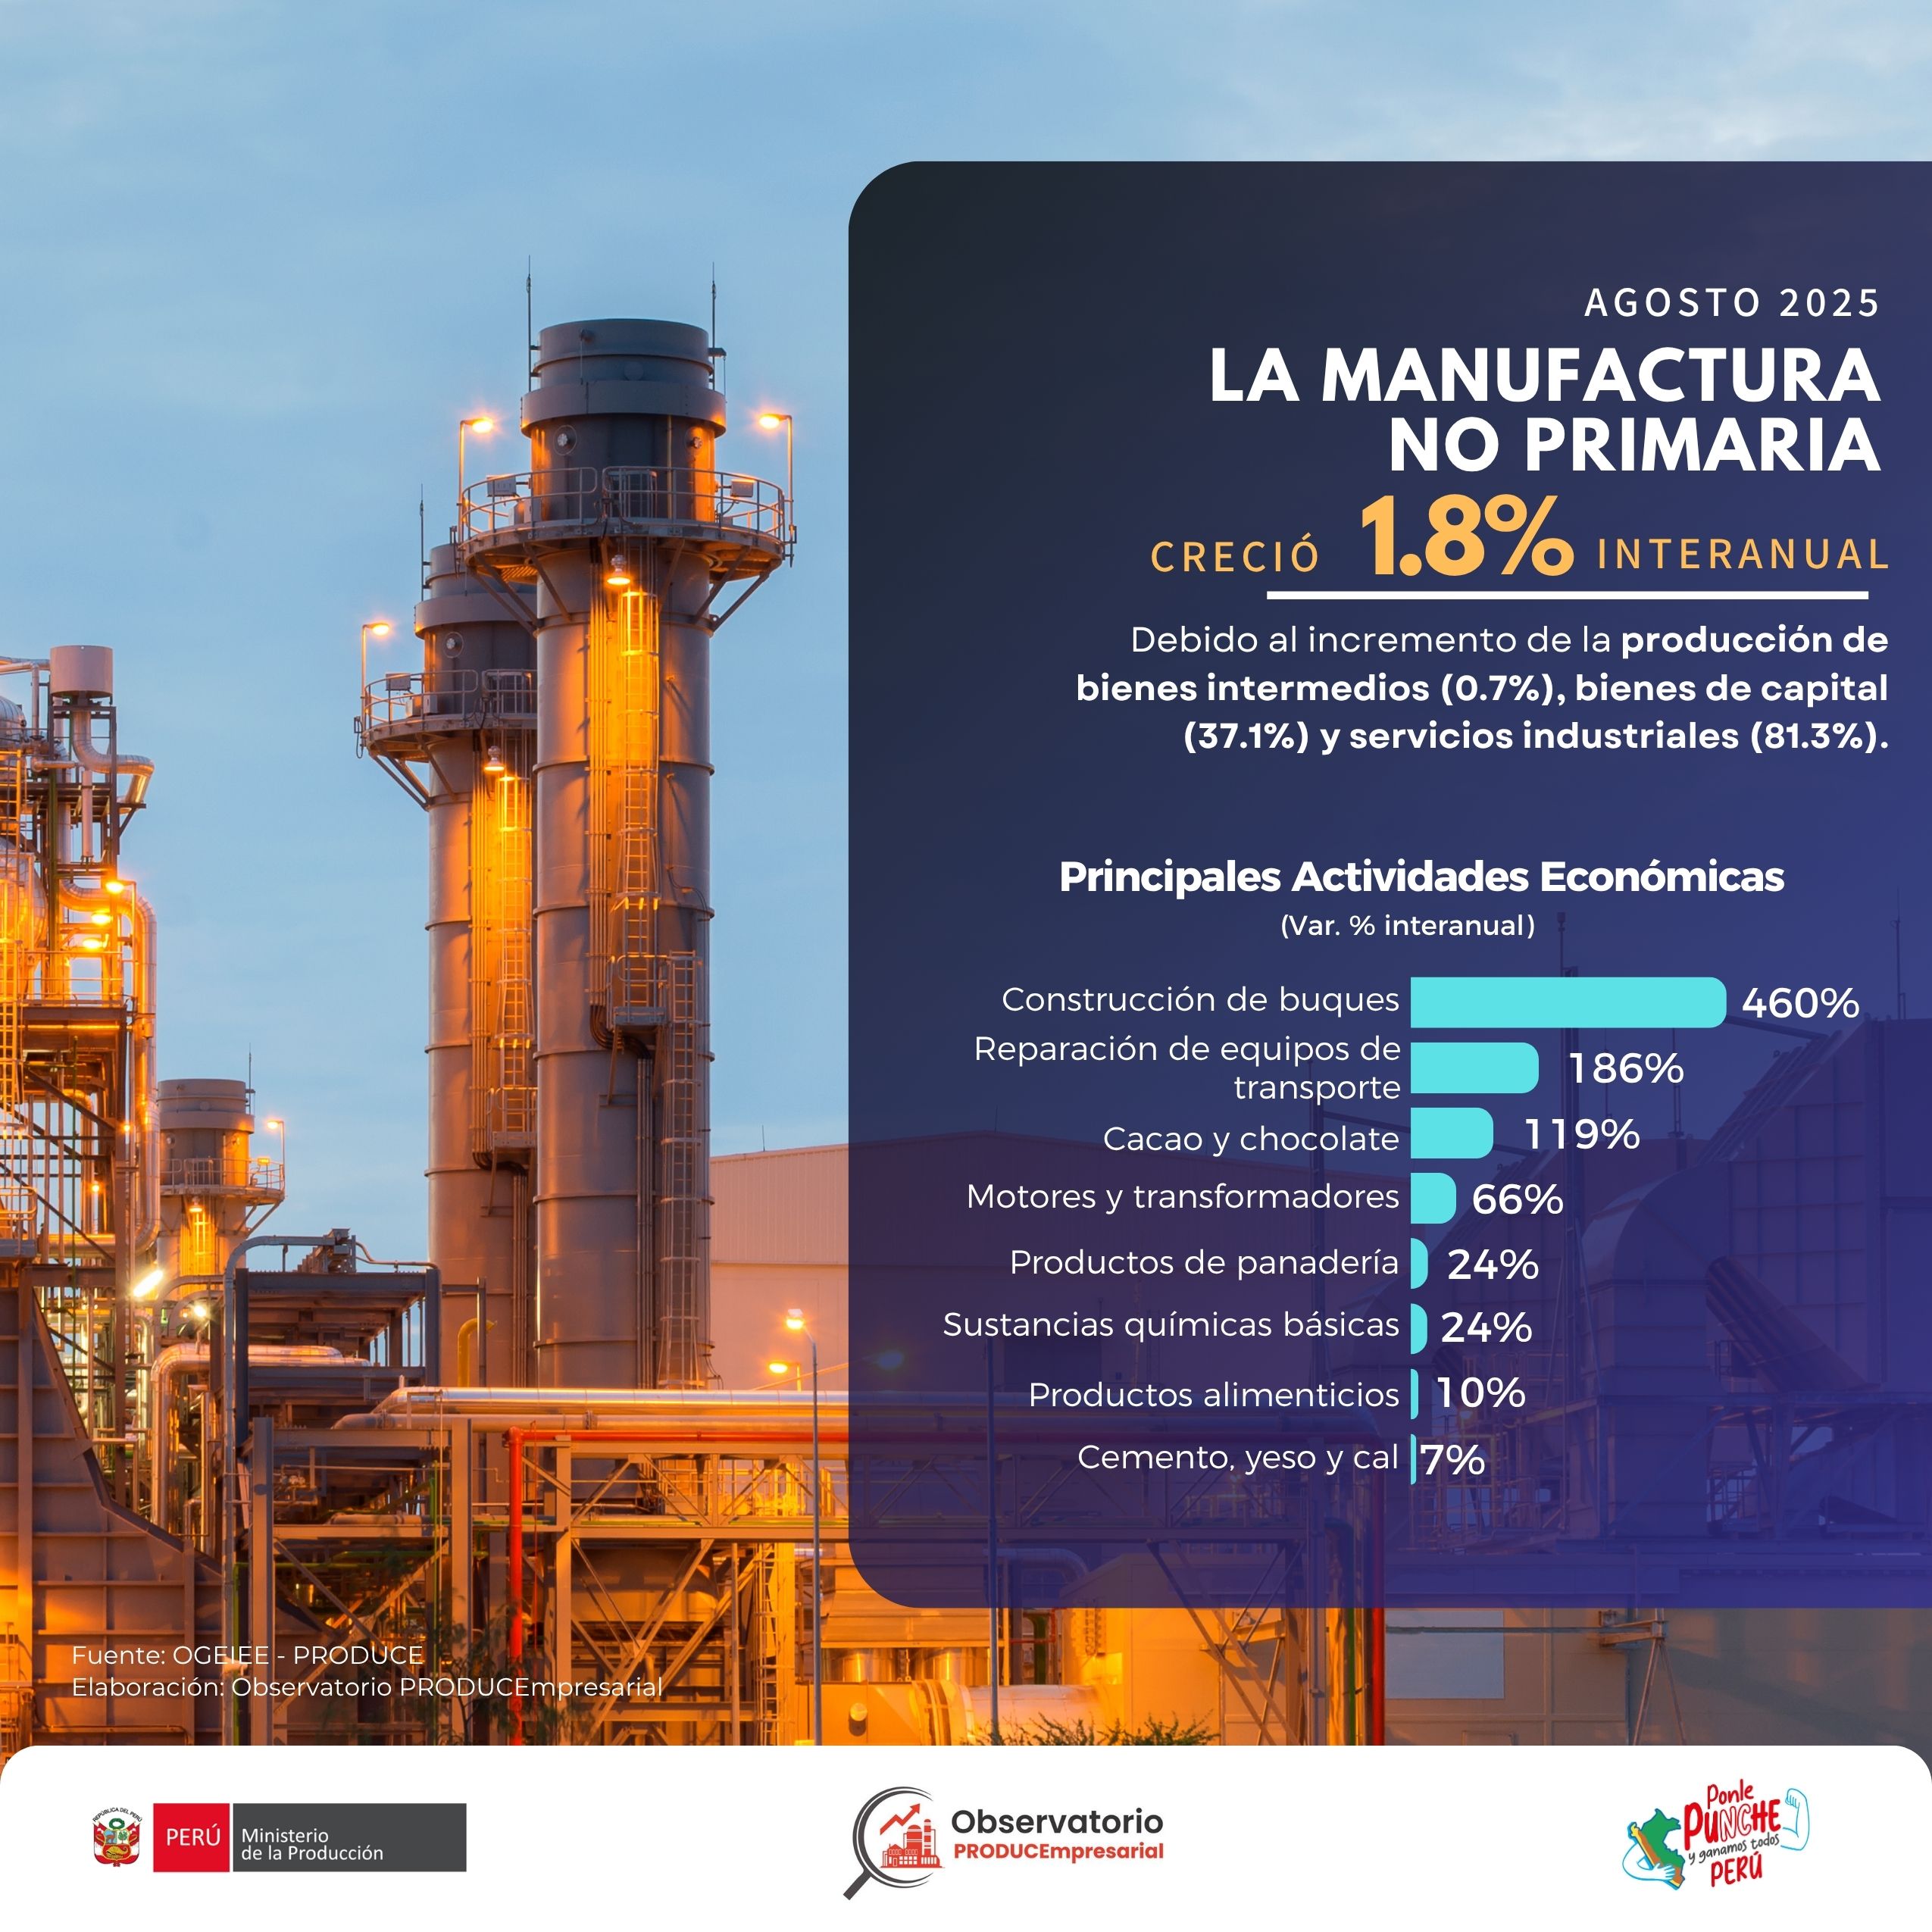
In January 2026, manufacturing GDP experienced a slight decline of 1.4% compared to January 2025, mainly due to a contraction in non-primary manufacturing (-2.2%). This result was partially offset by modest growth in primary manufacturing (+0.4%), driven by greater availability of raw materials for the primary metals industry.
01
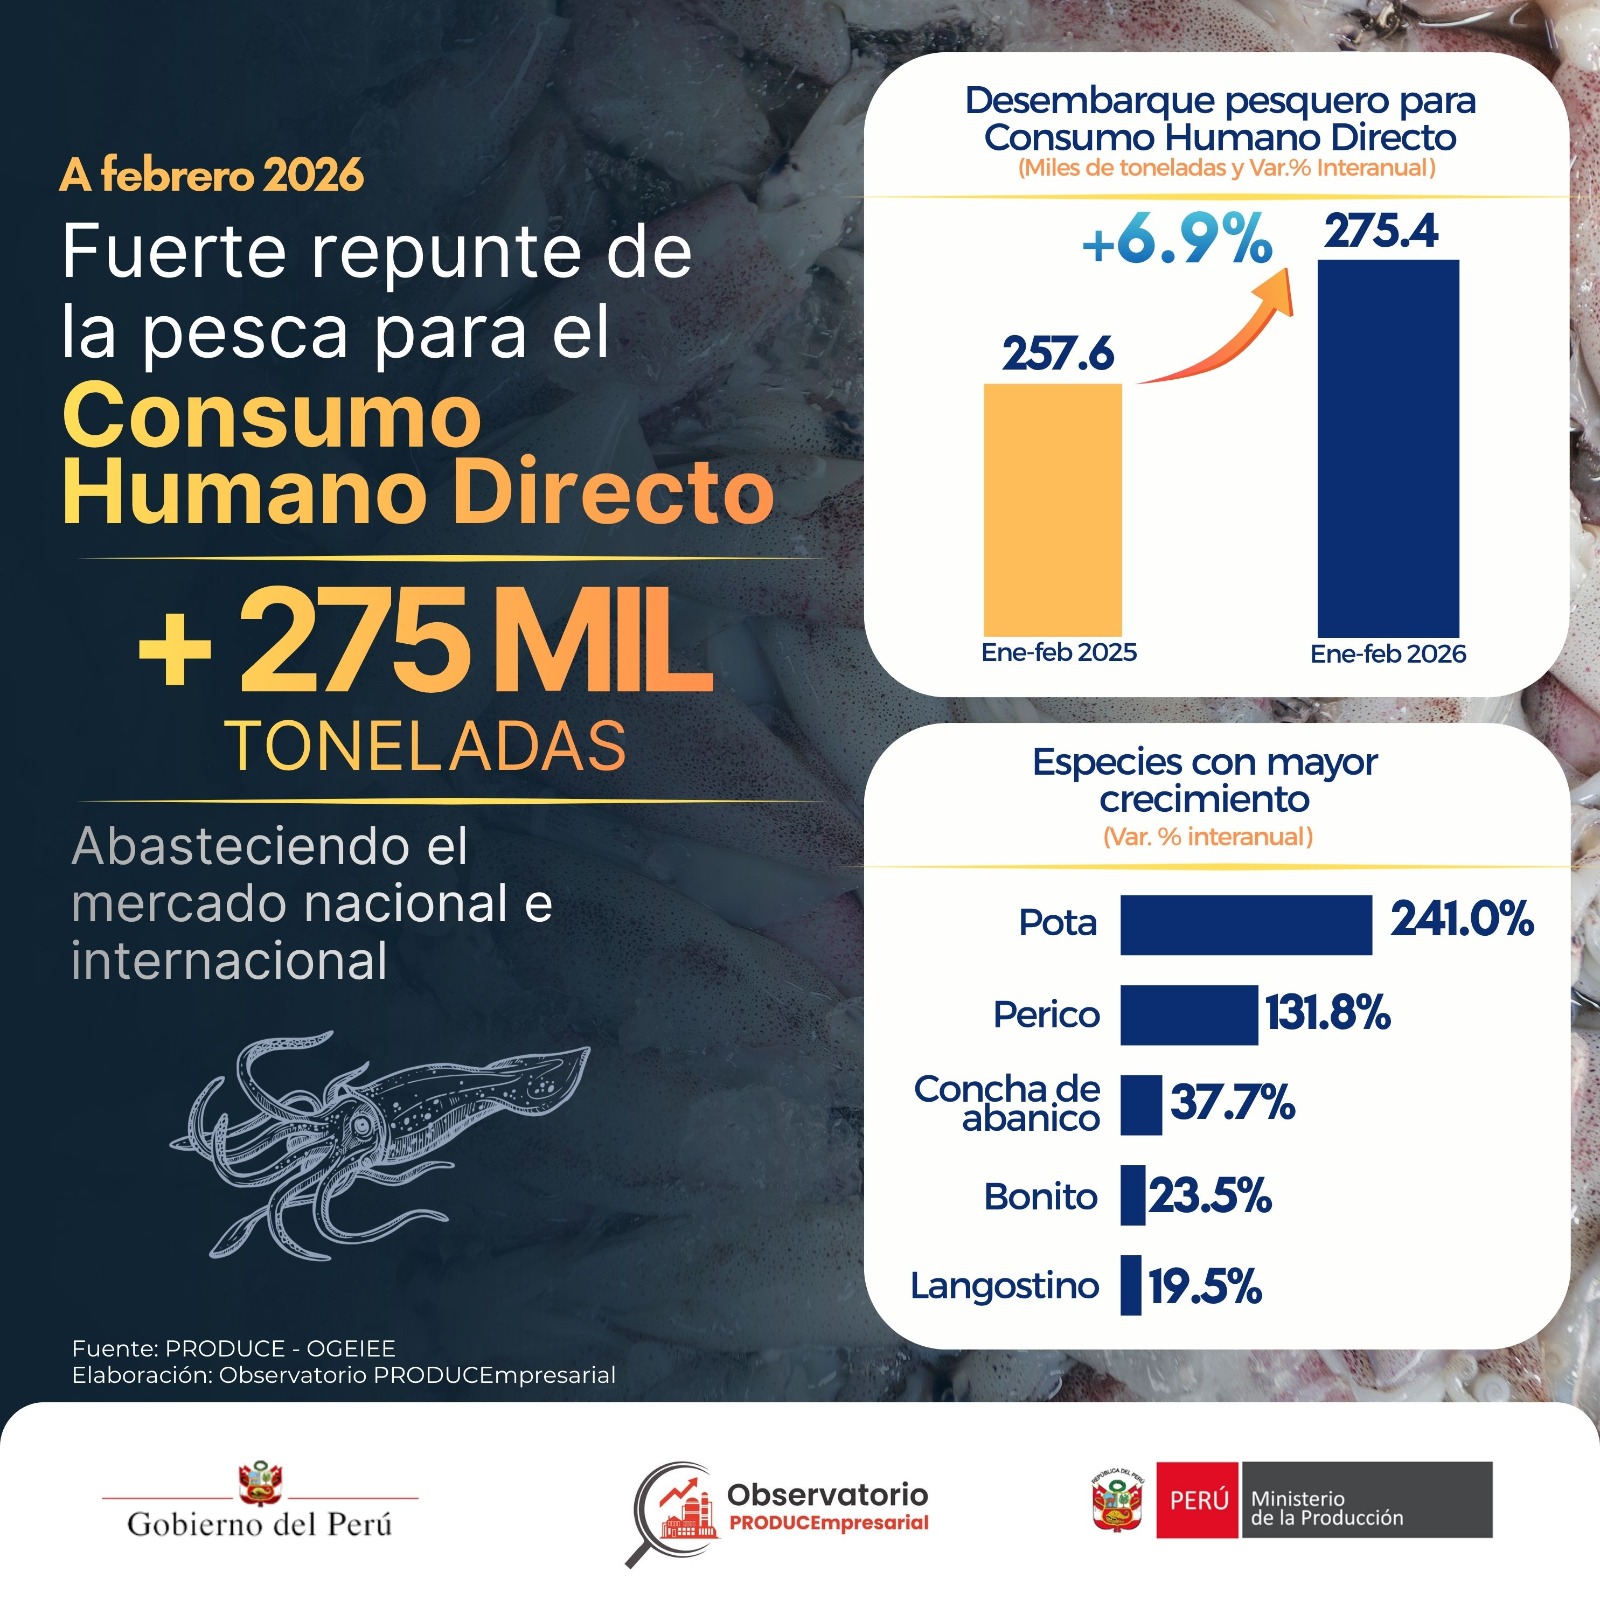
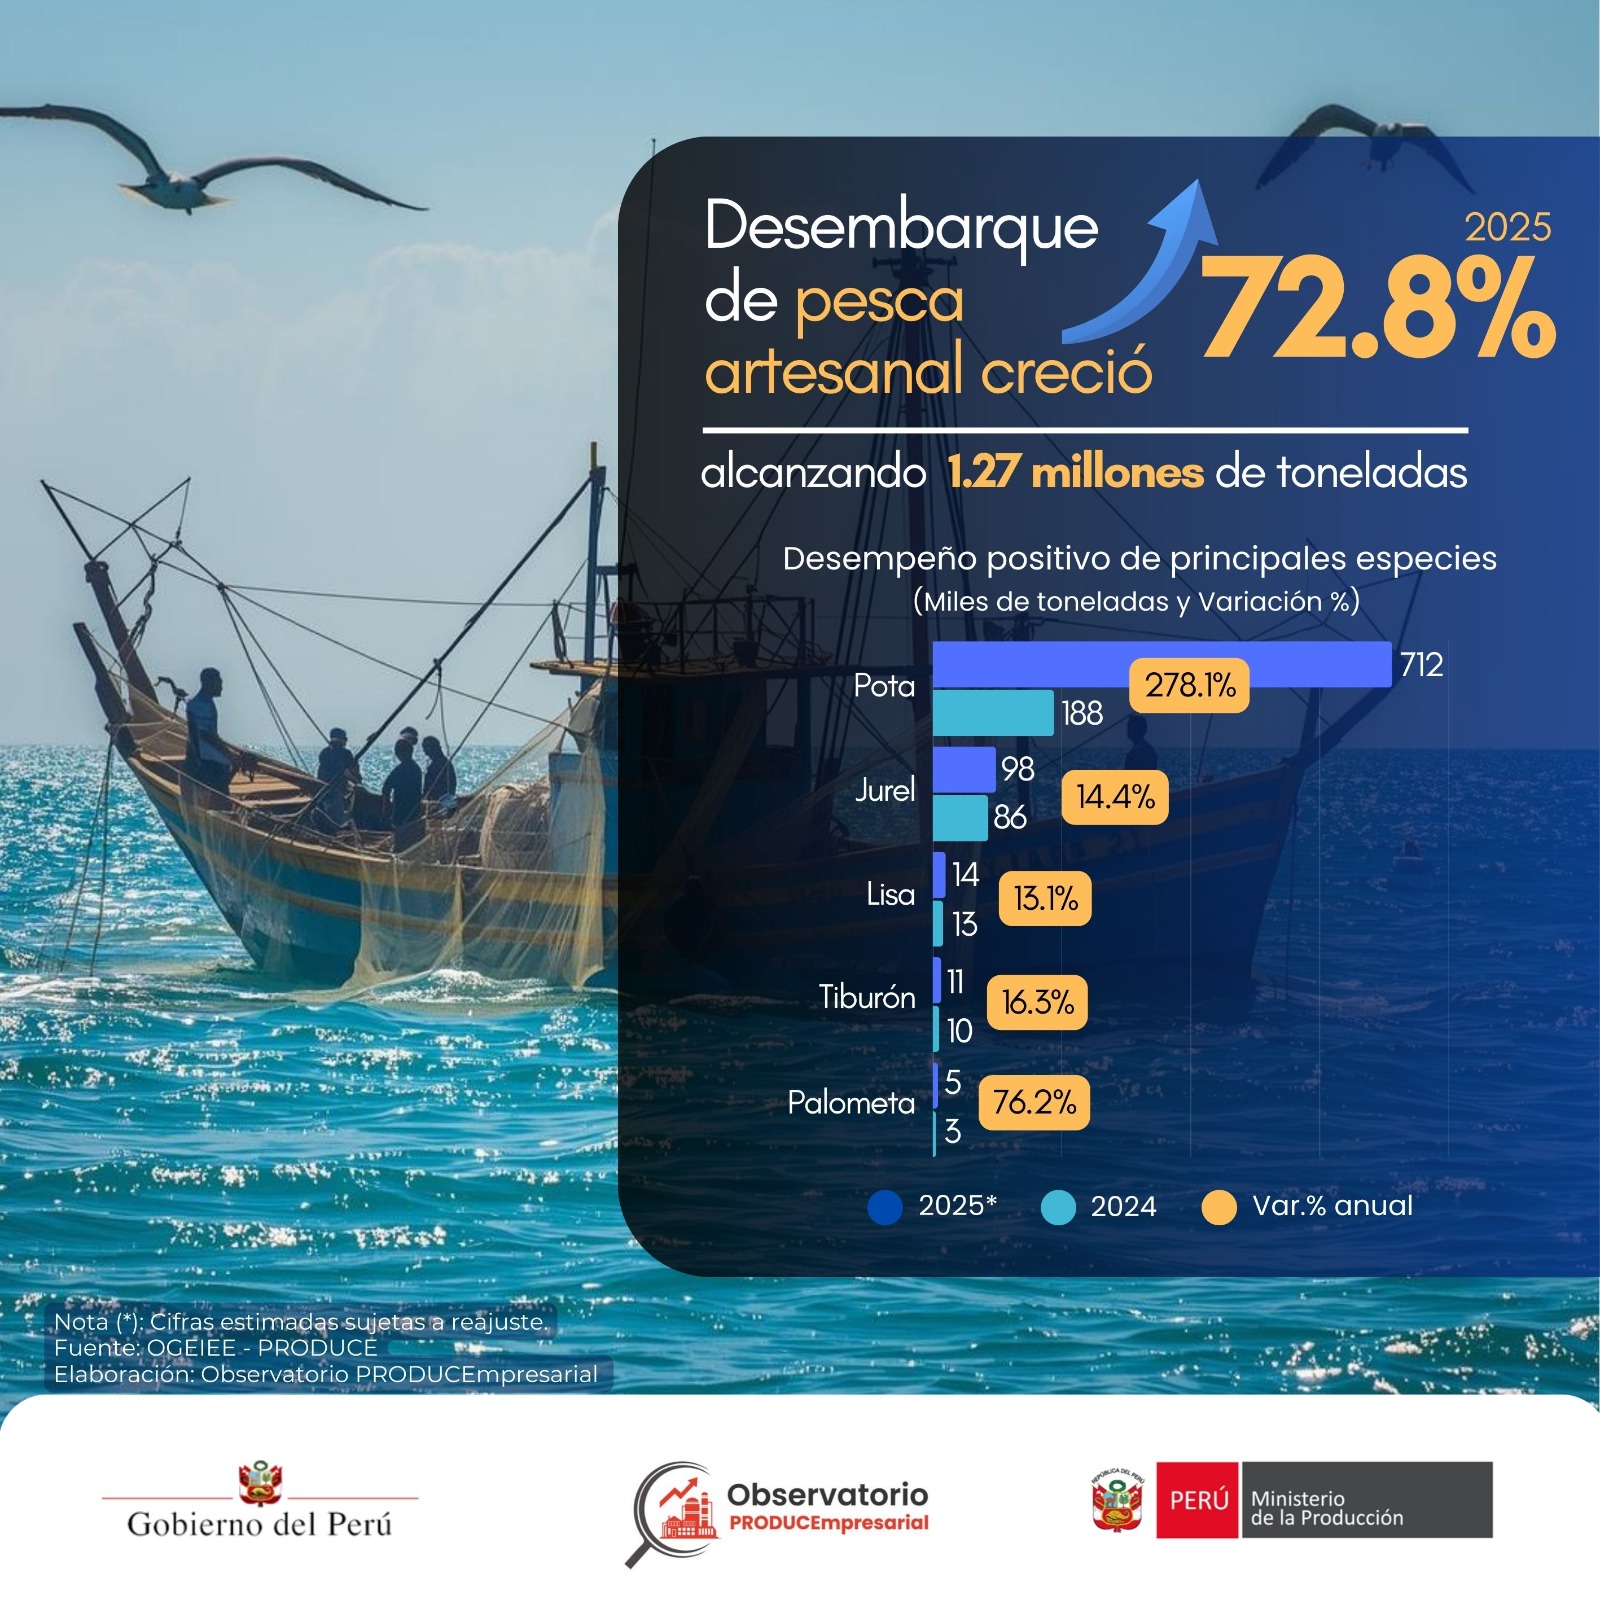
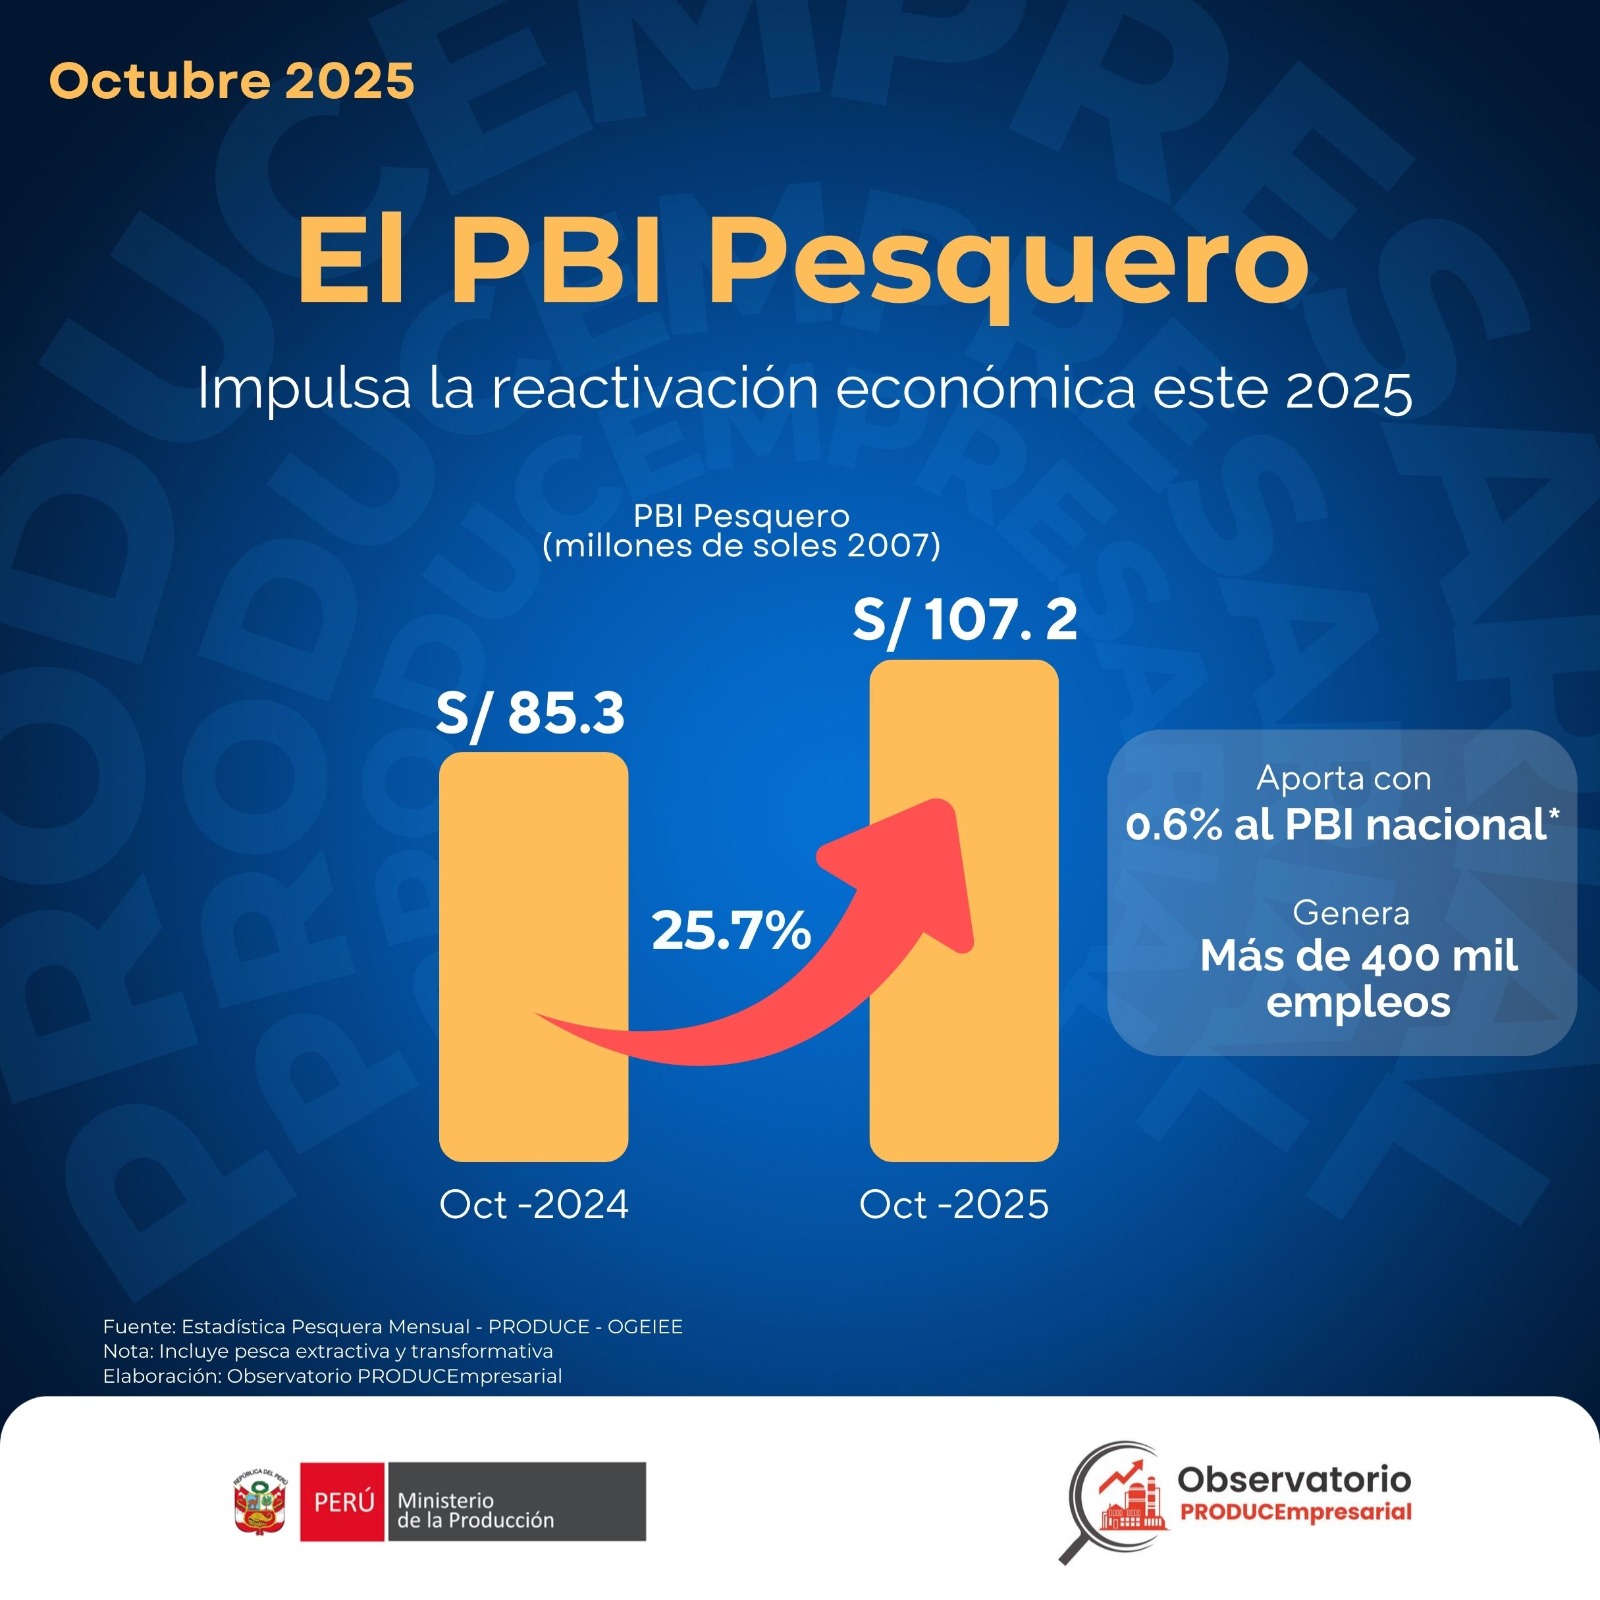
Fishing Sector
january 2026
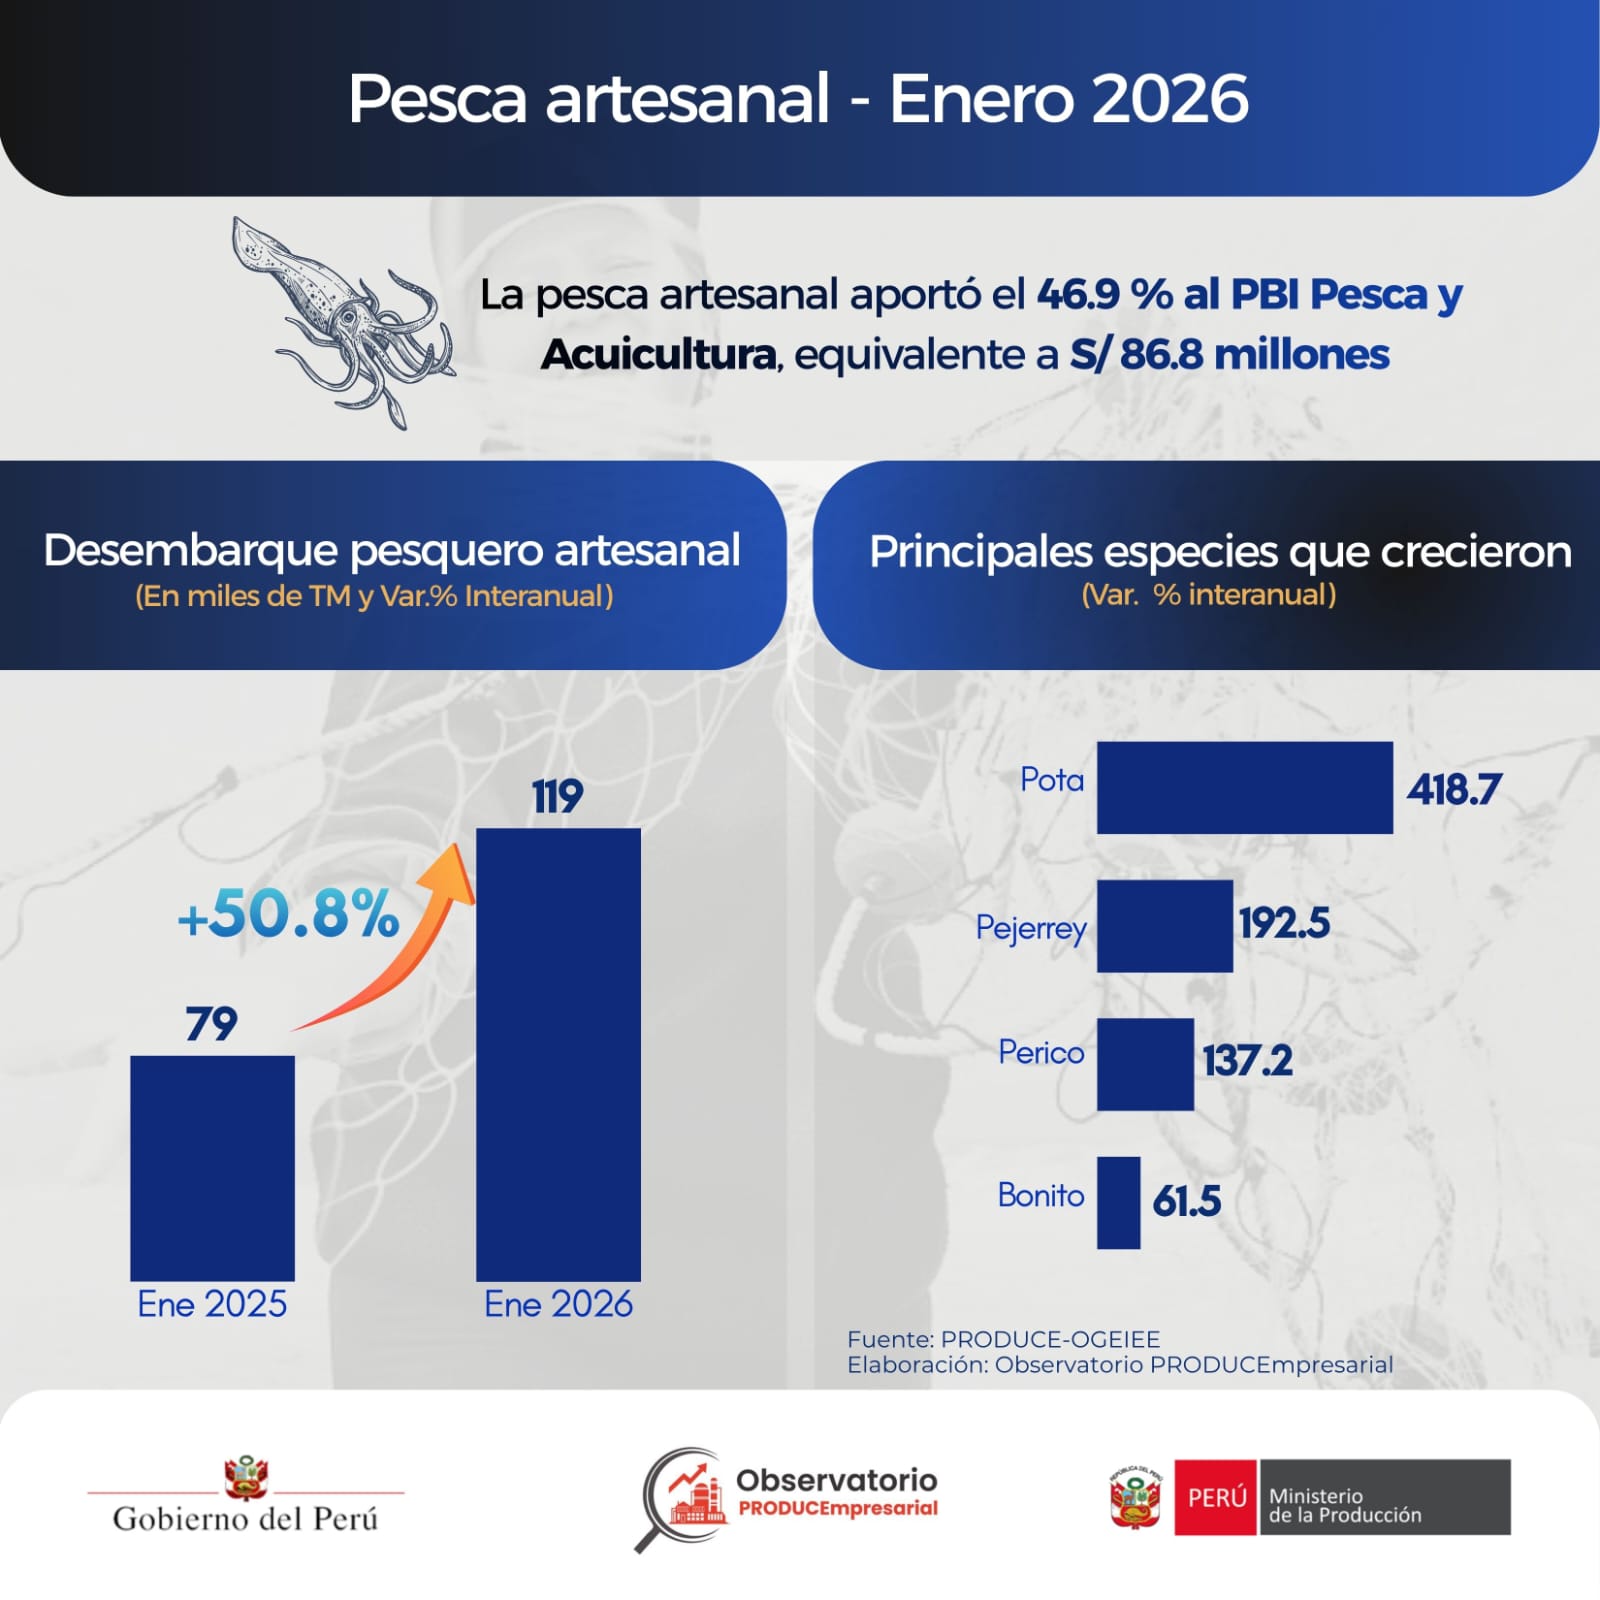
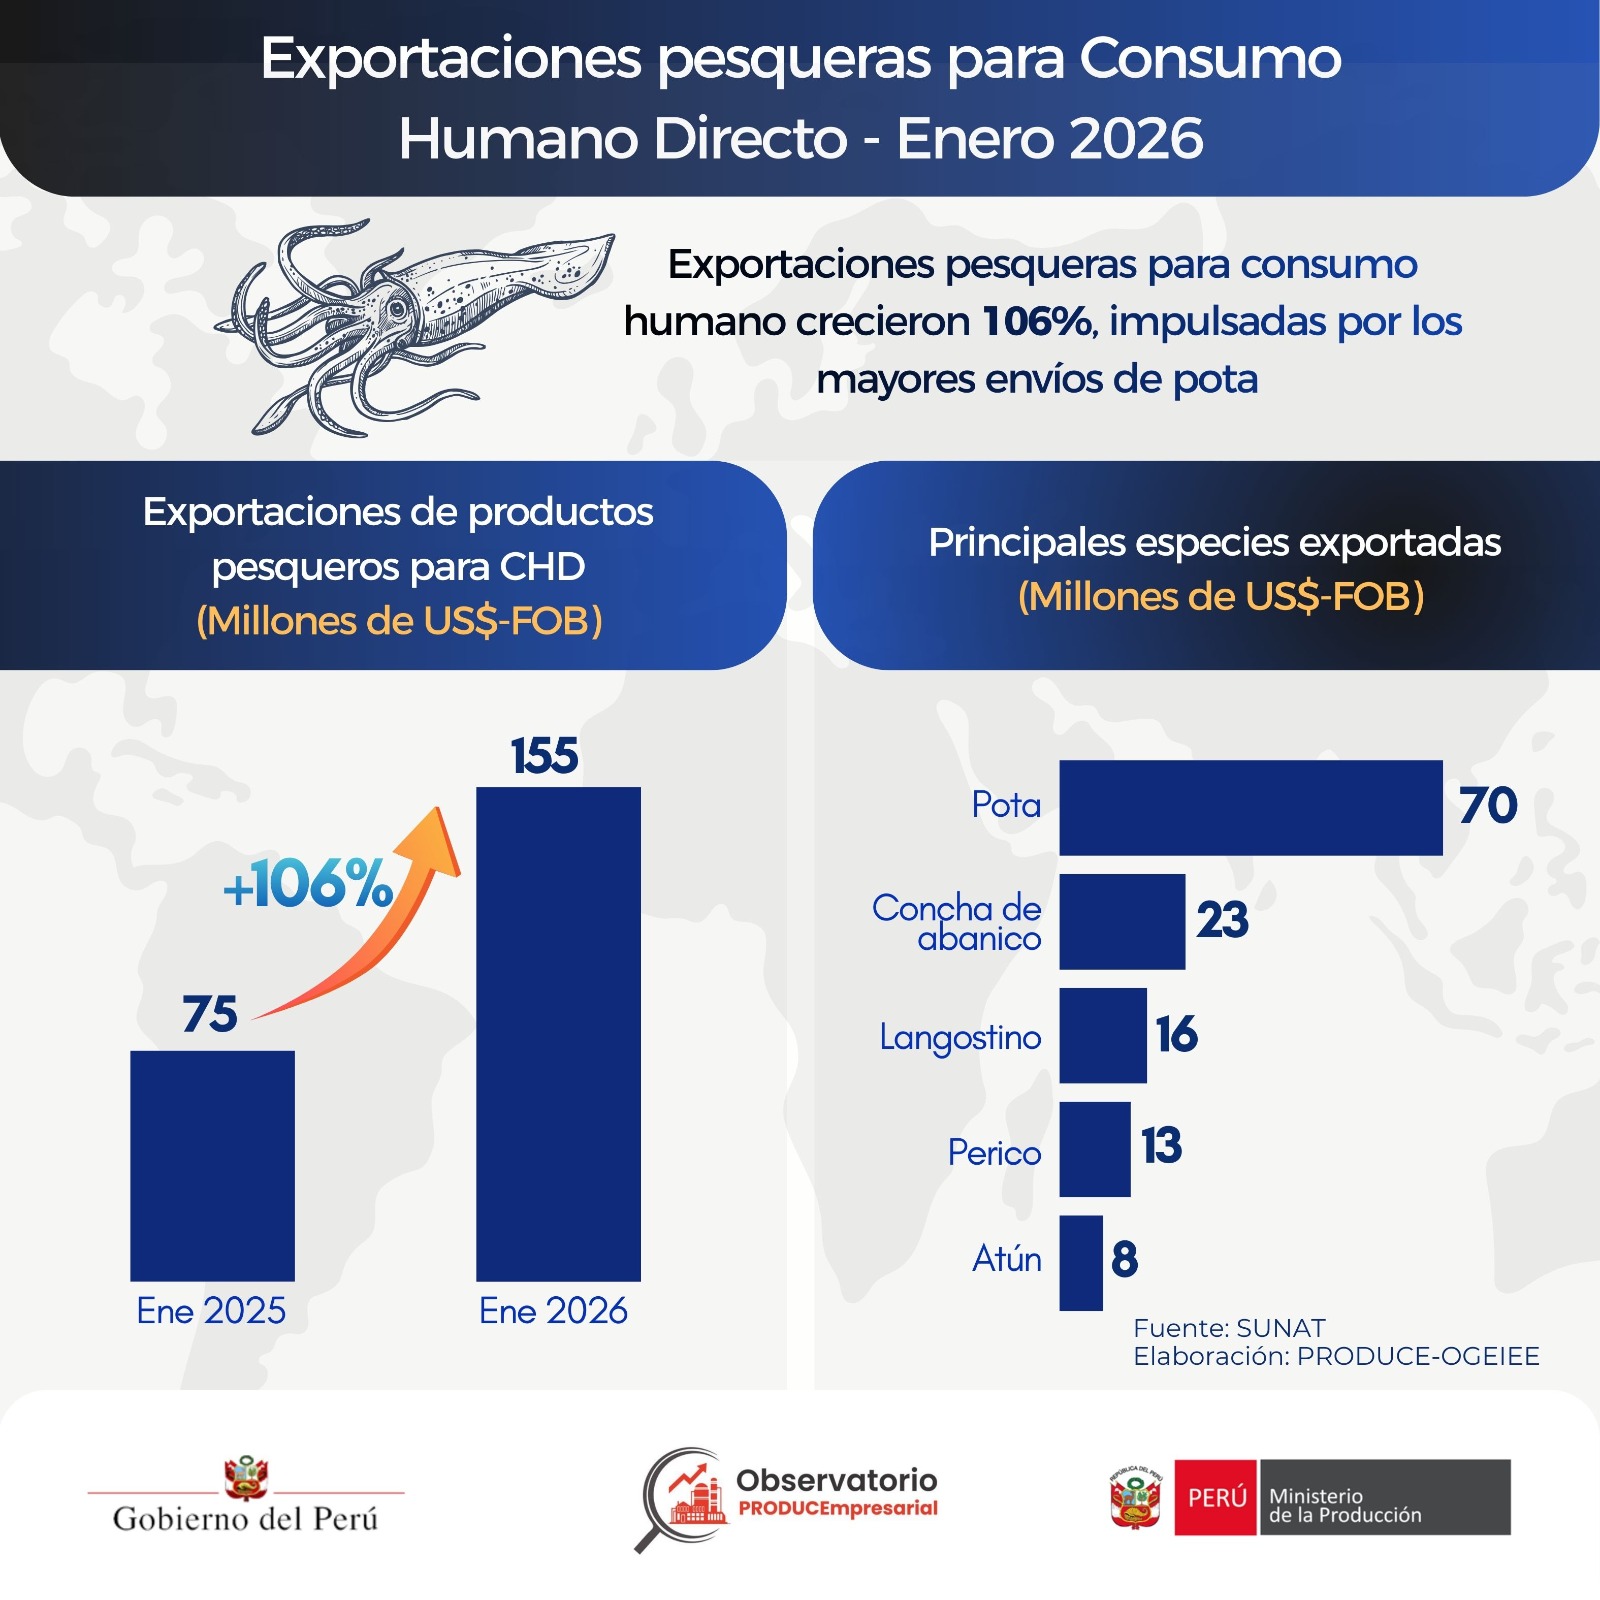
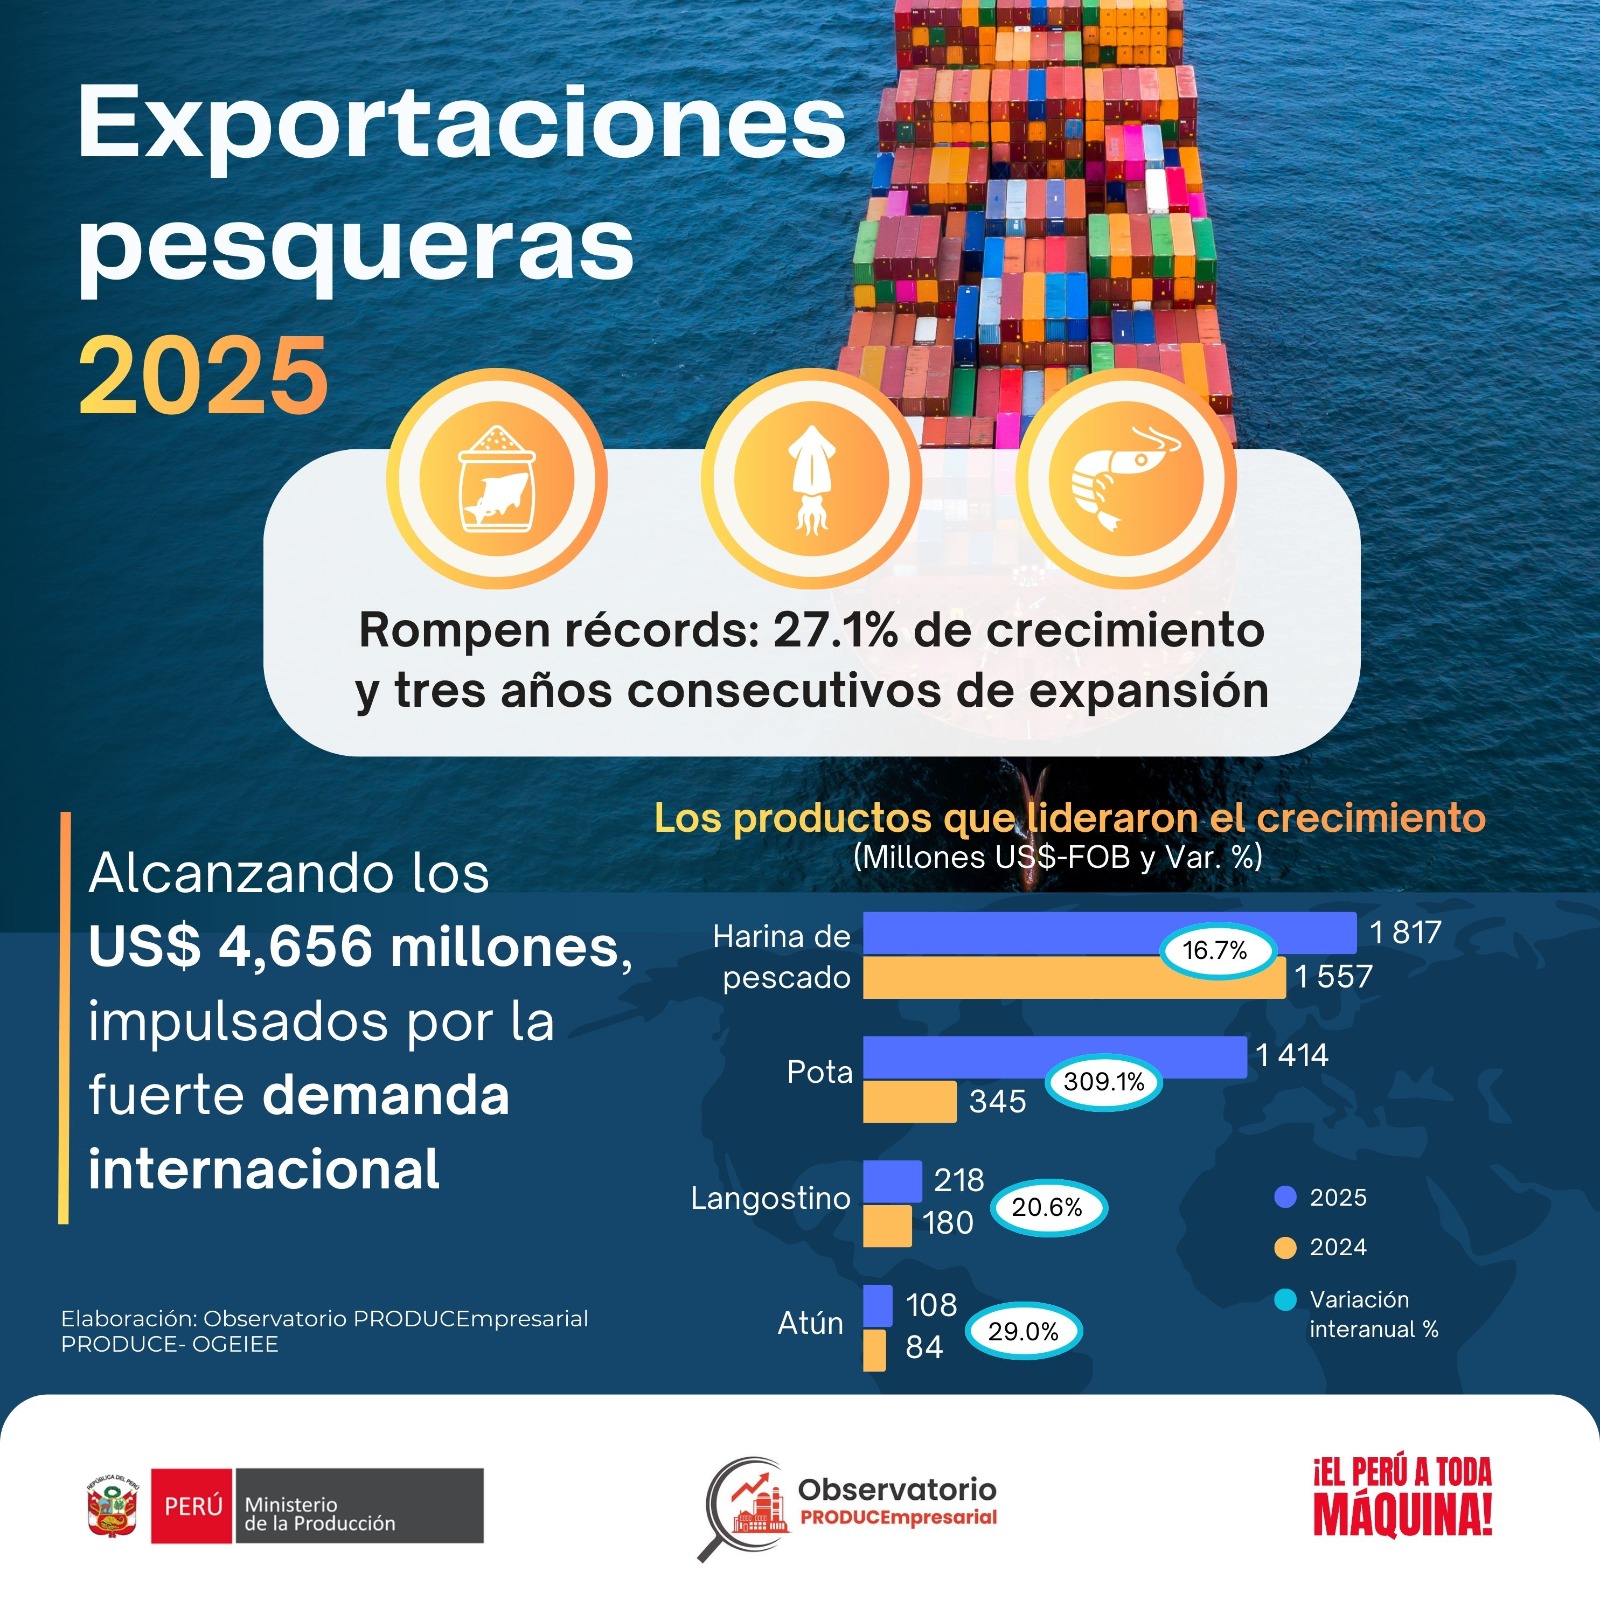
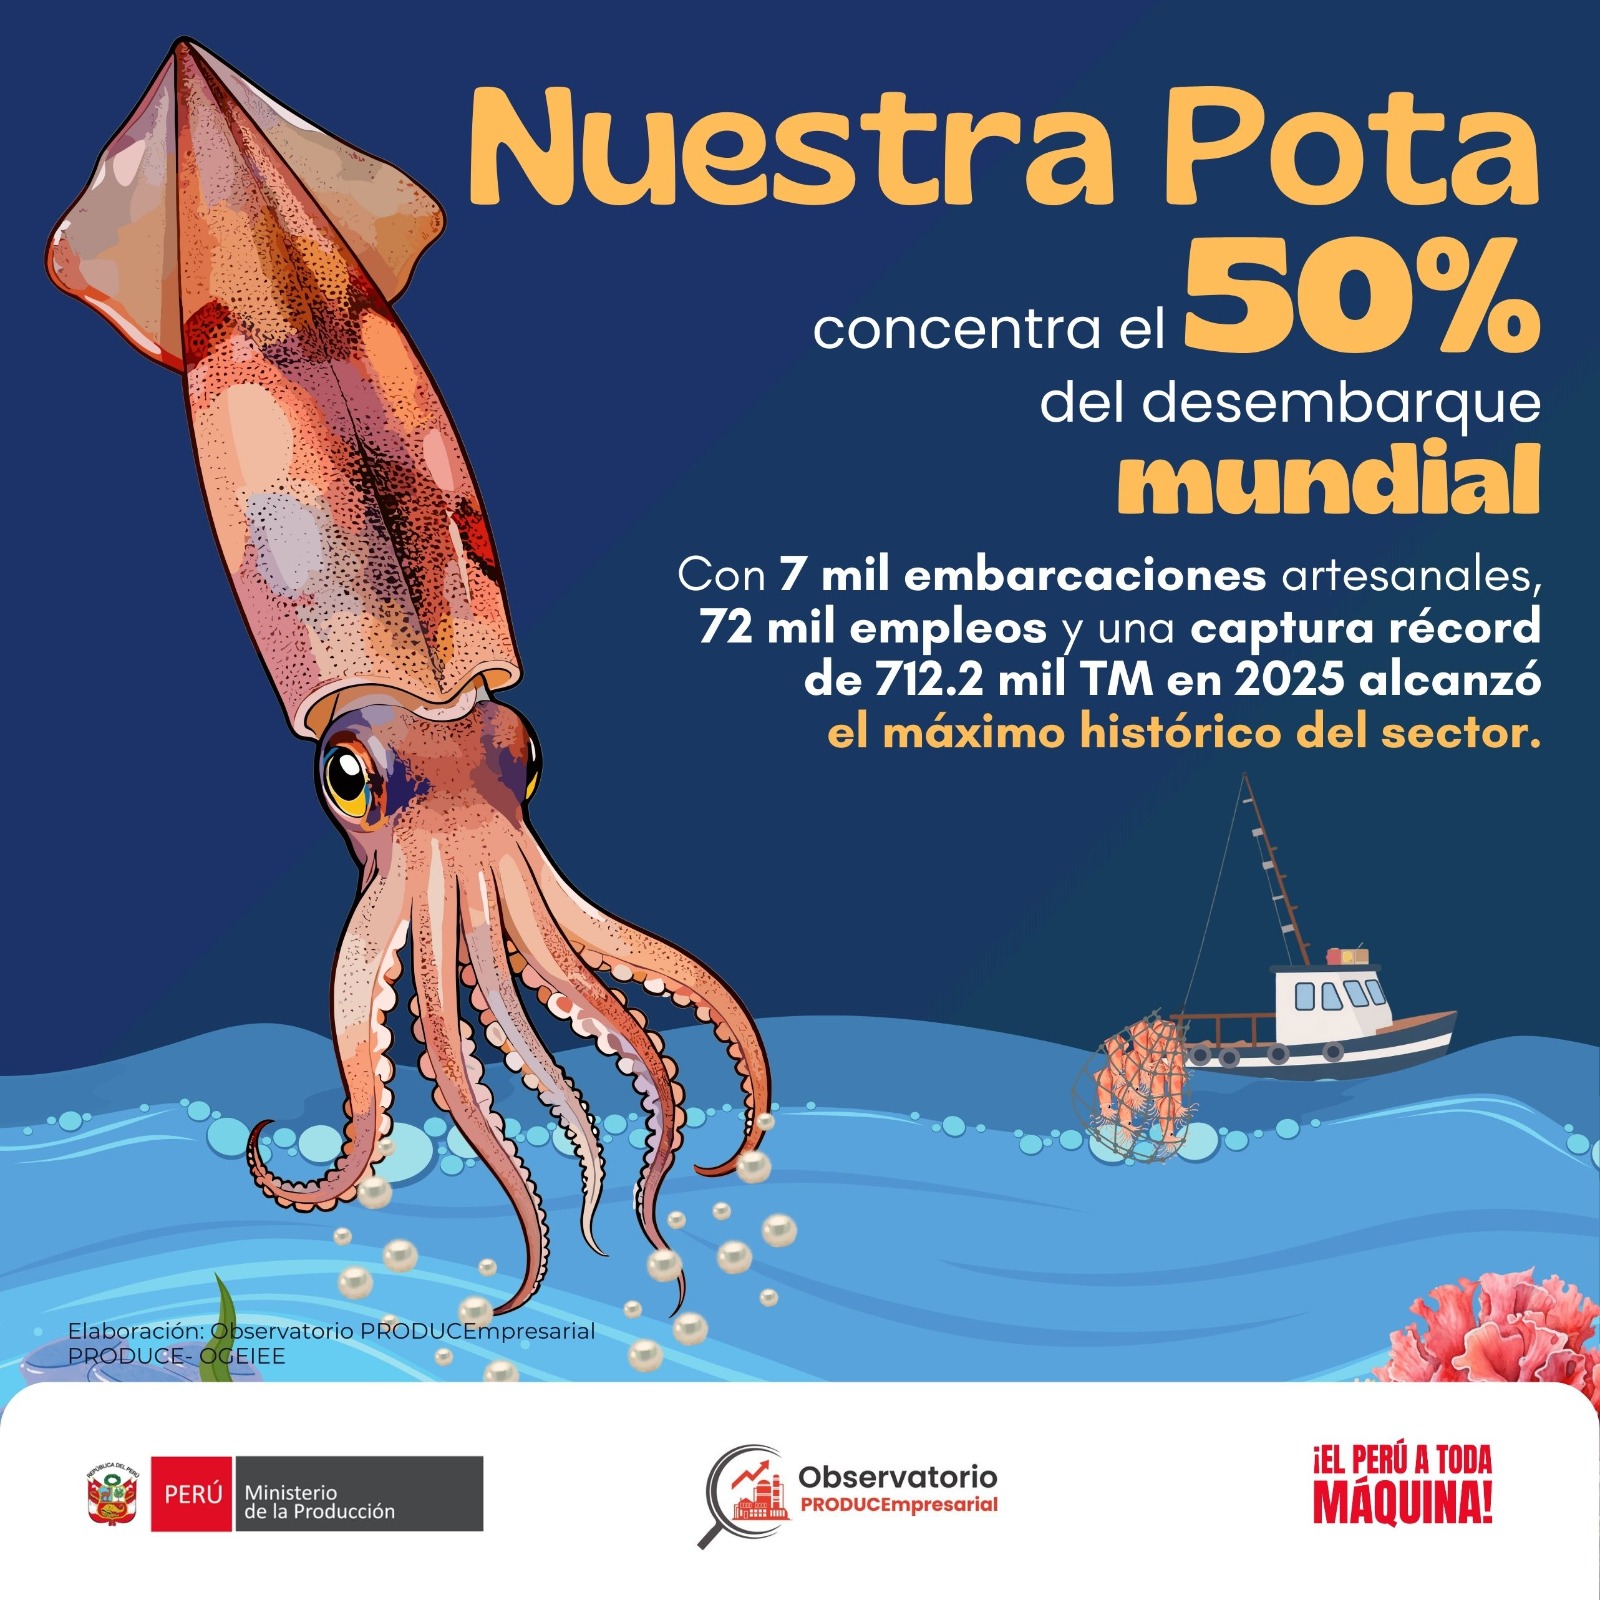
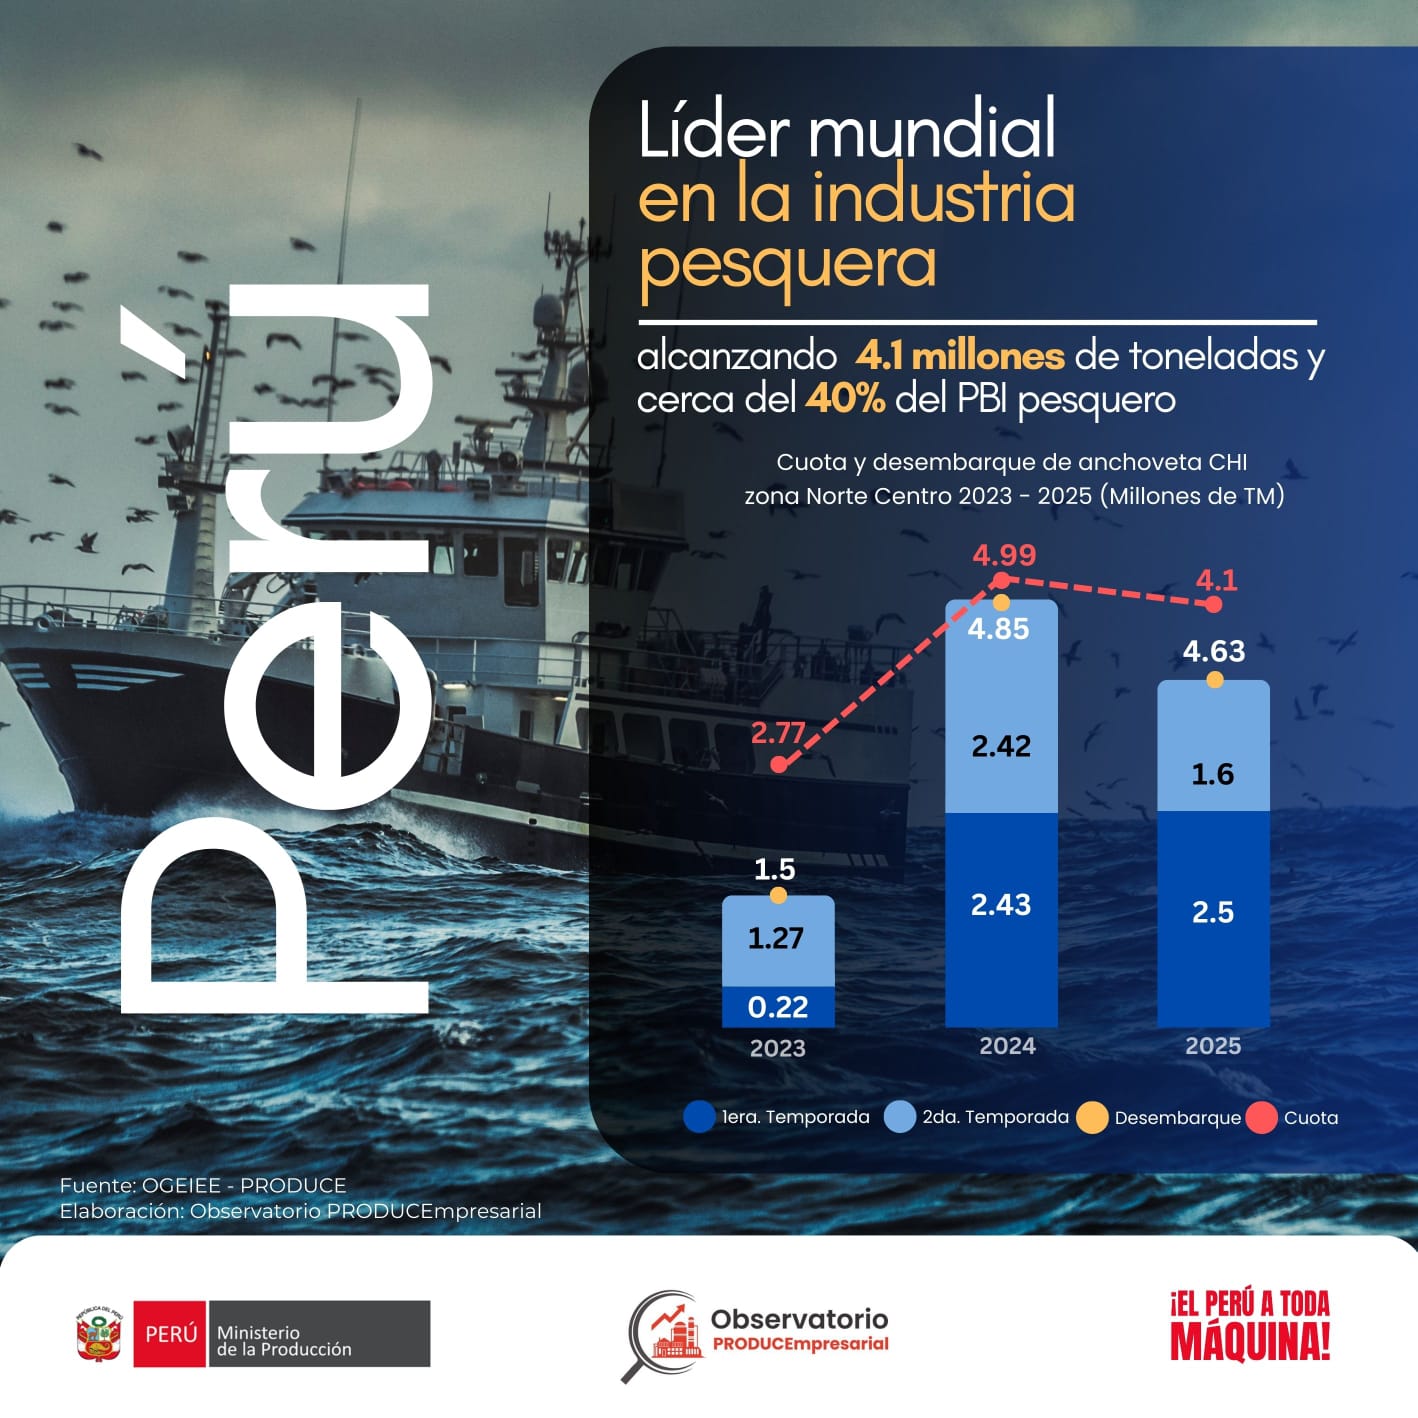
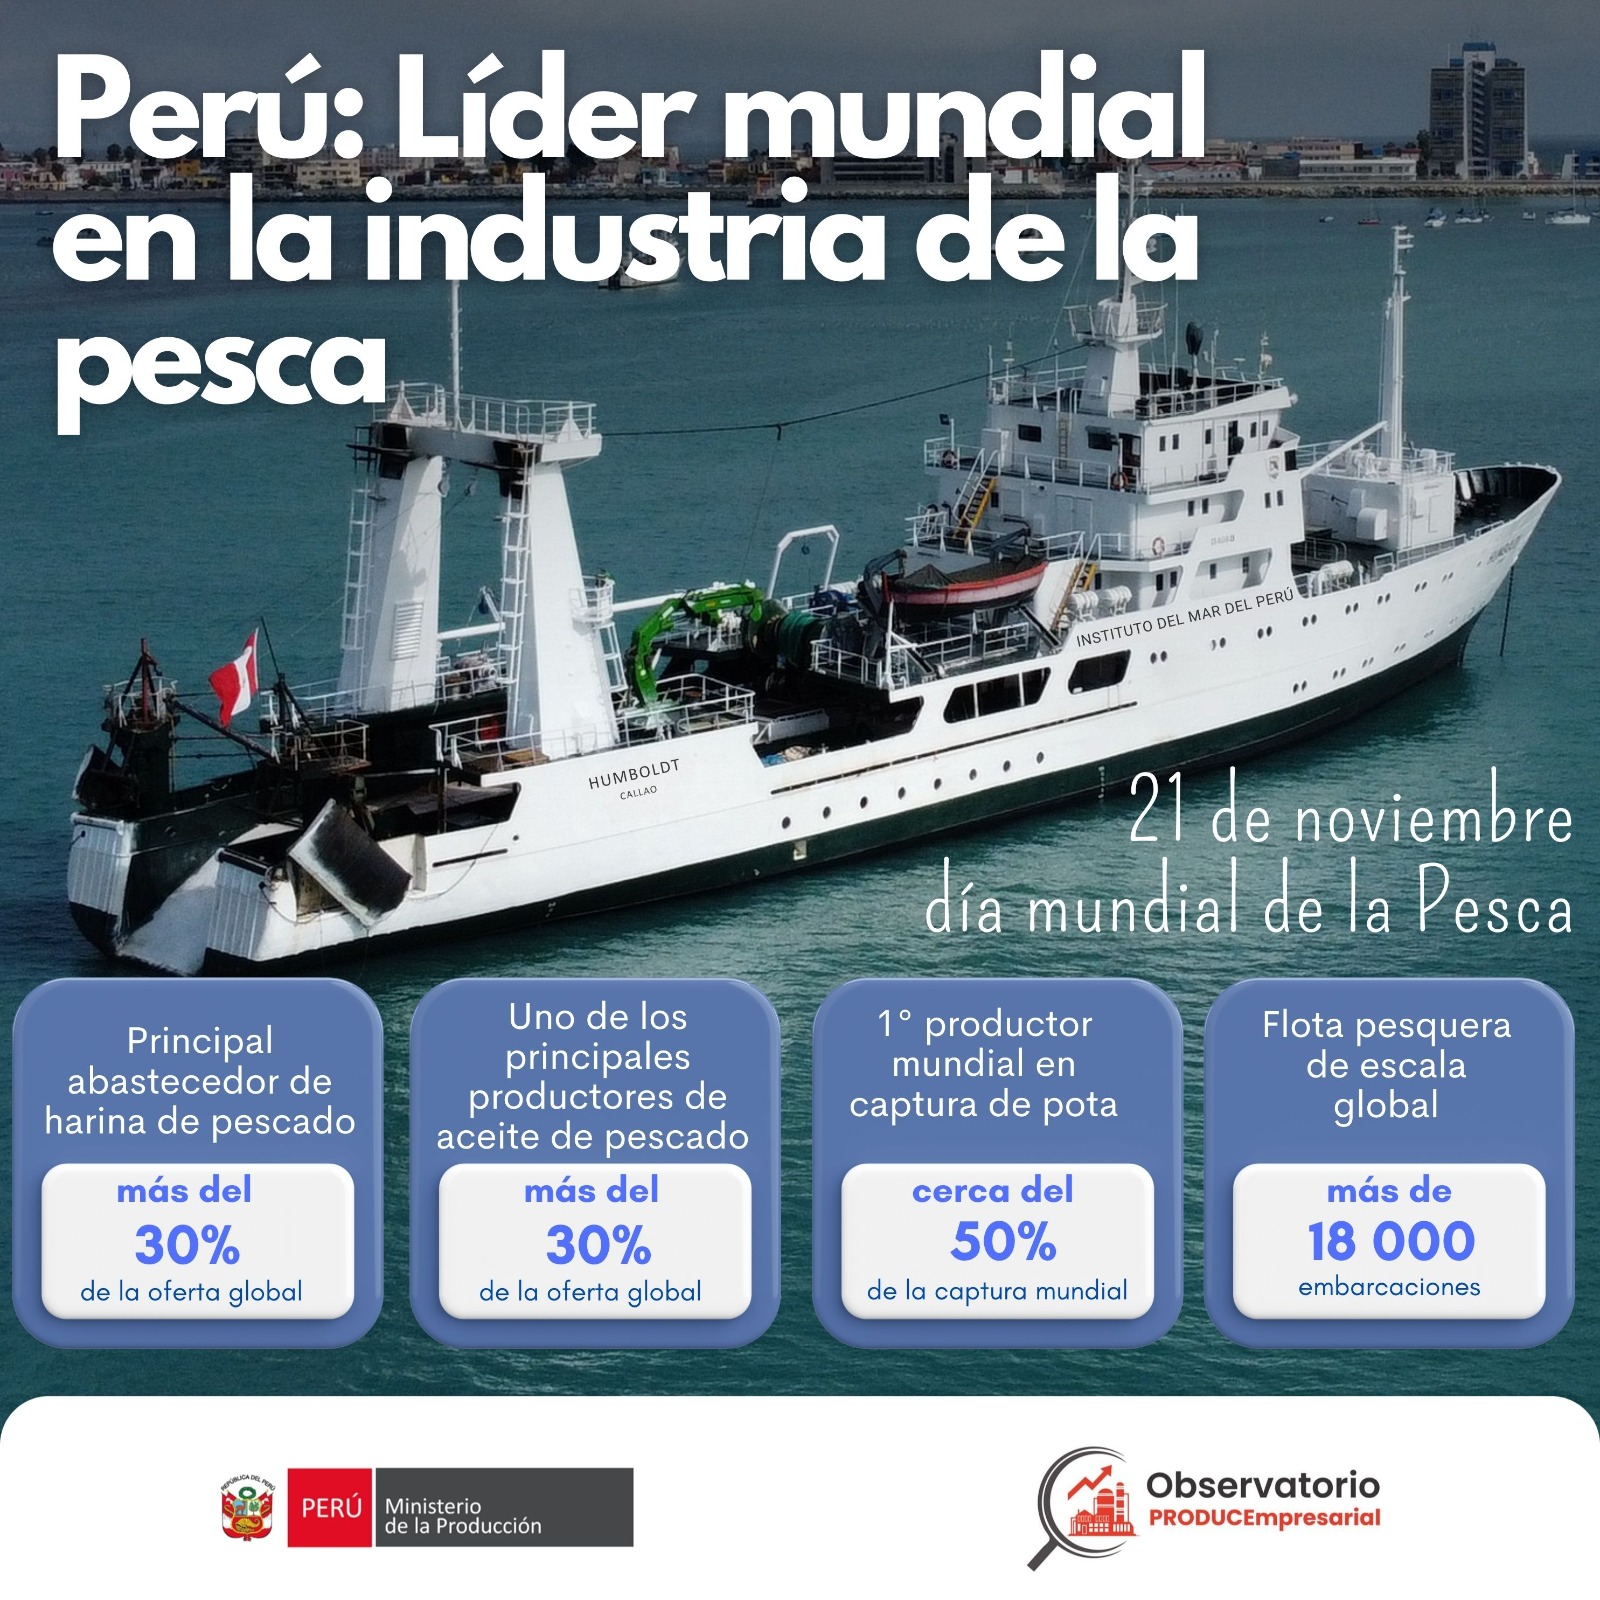
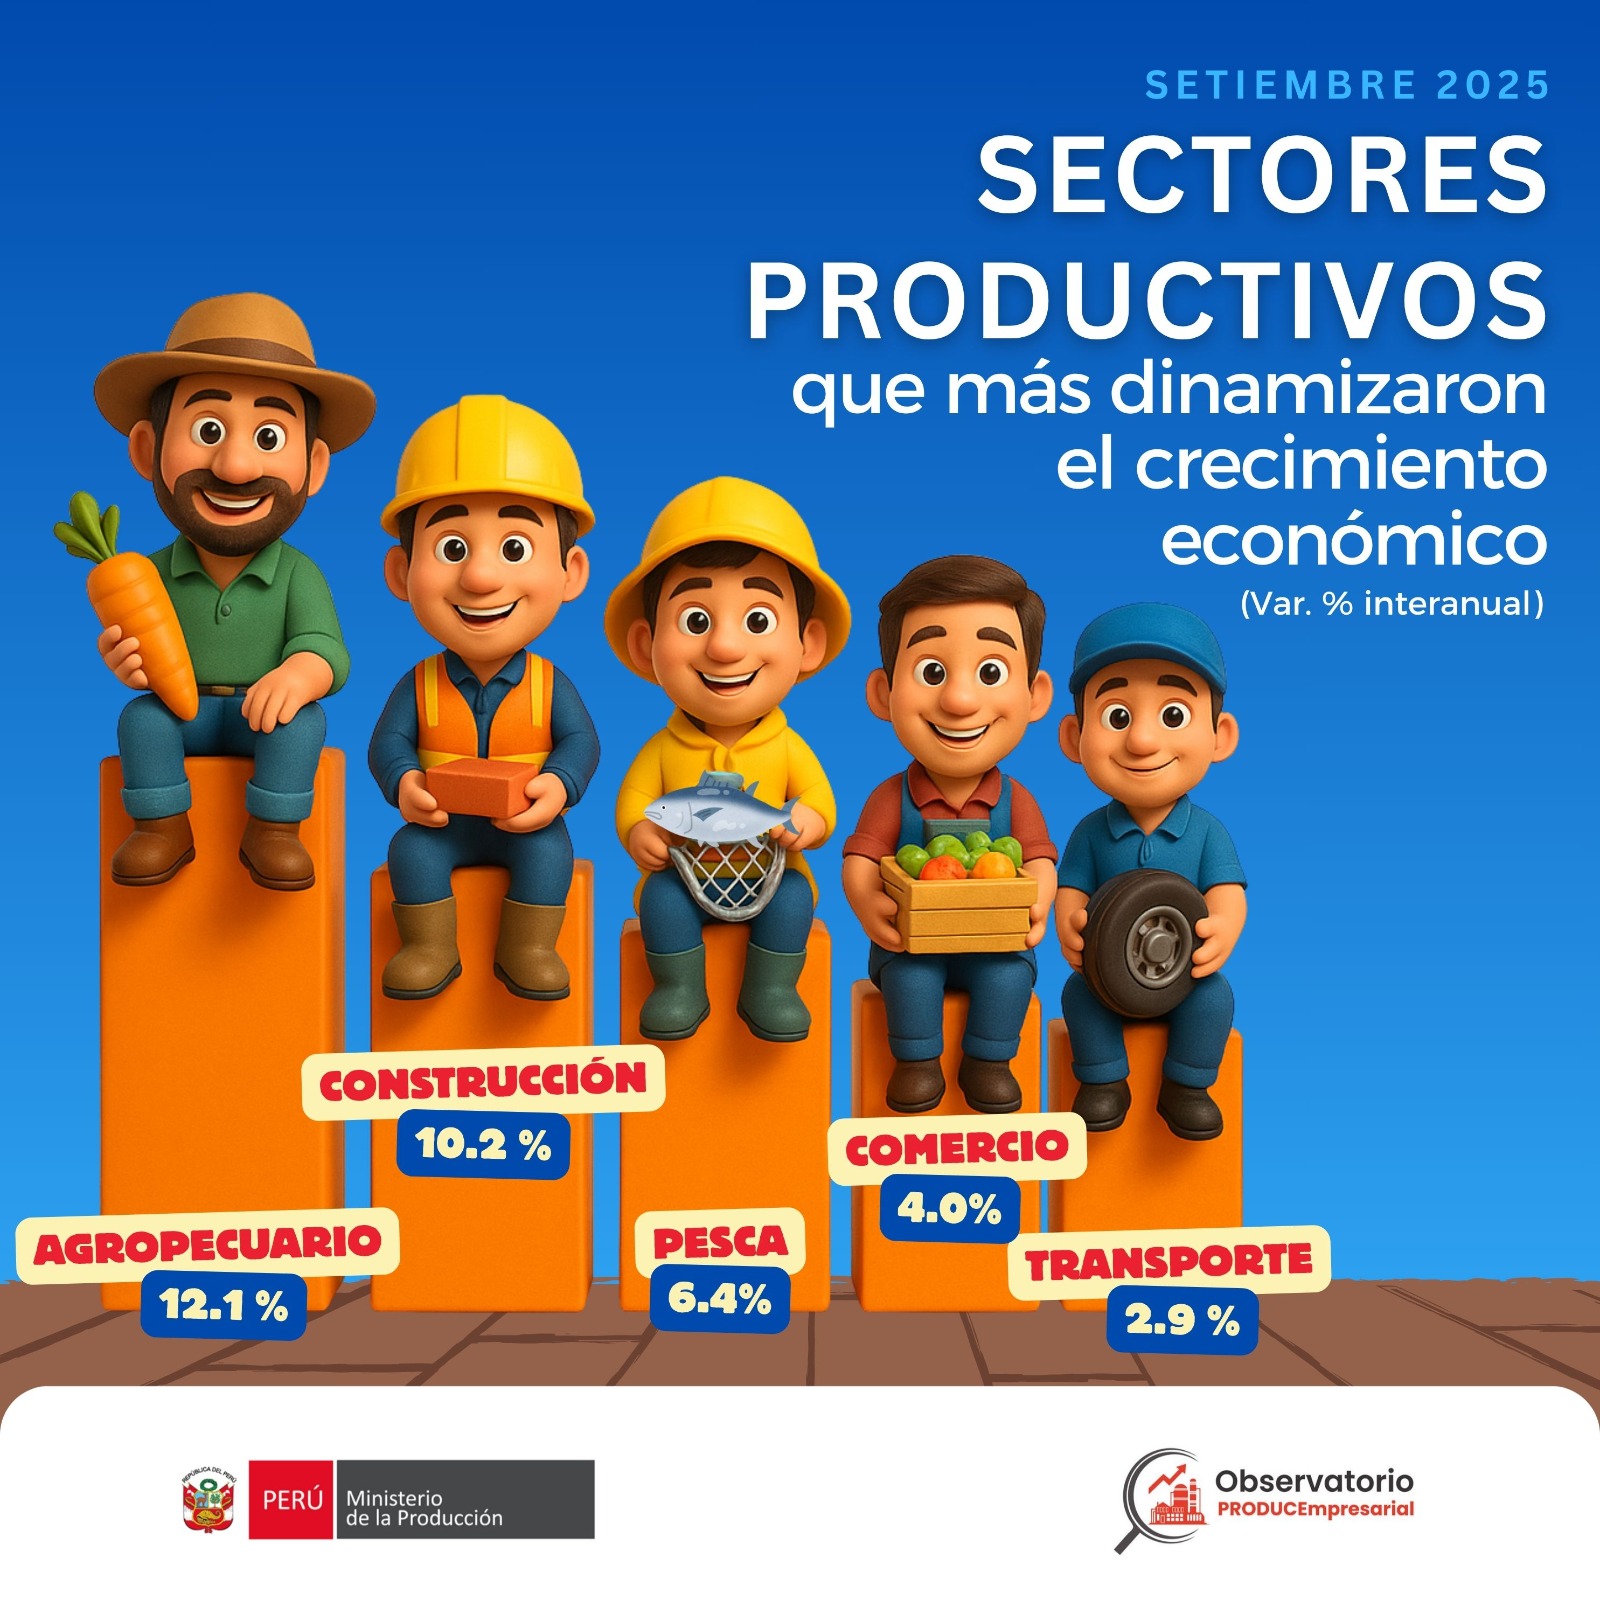
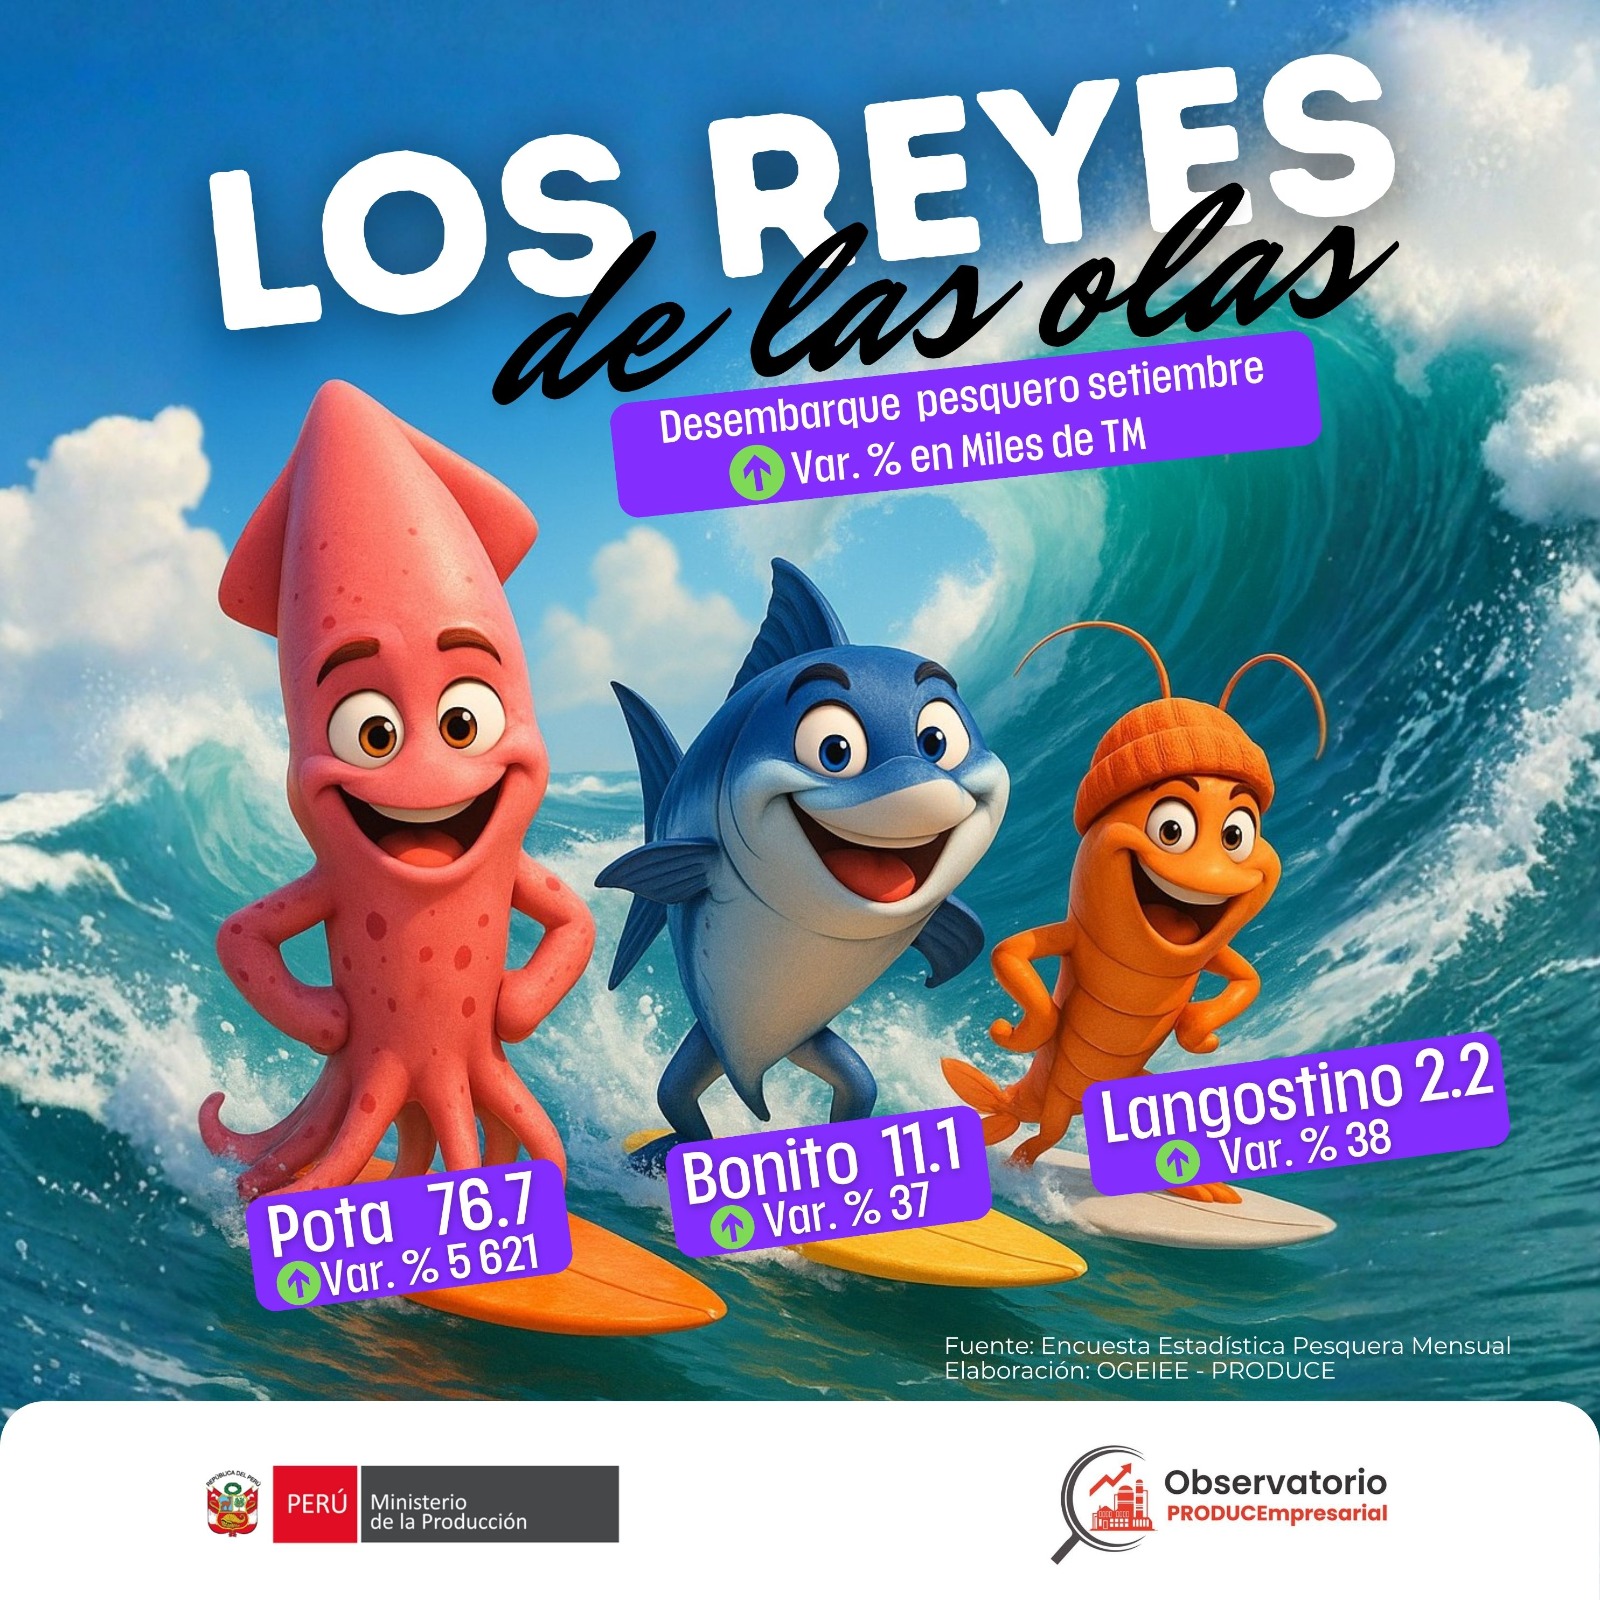
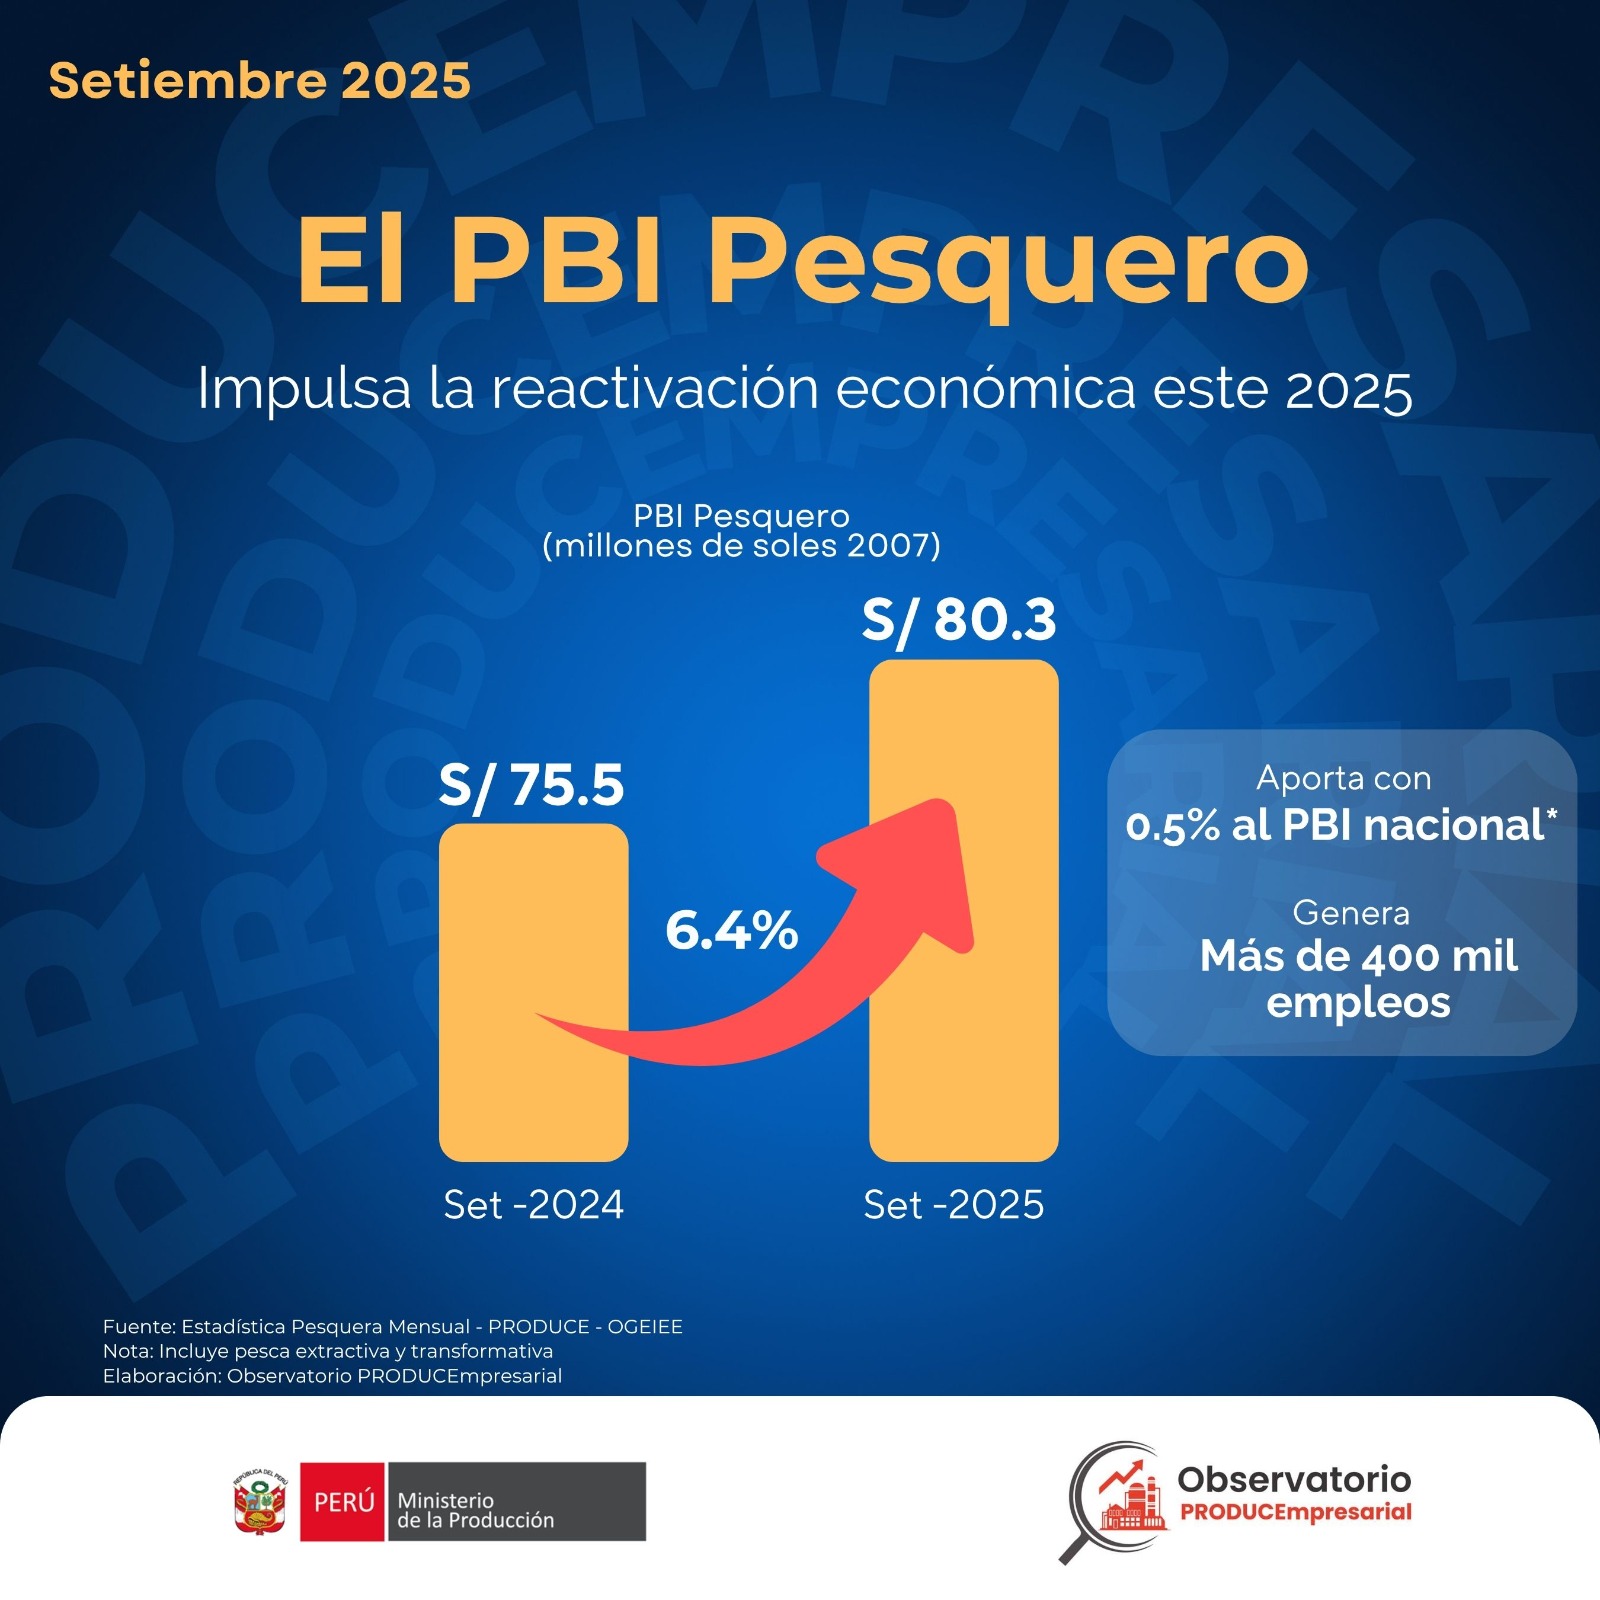
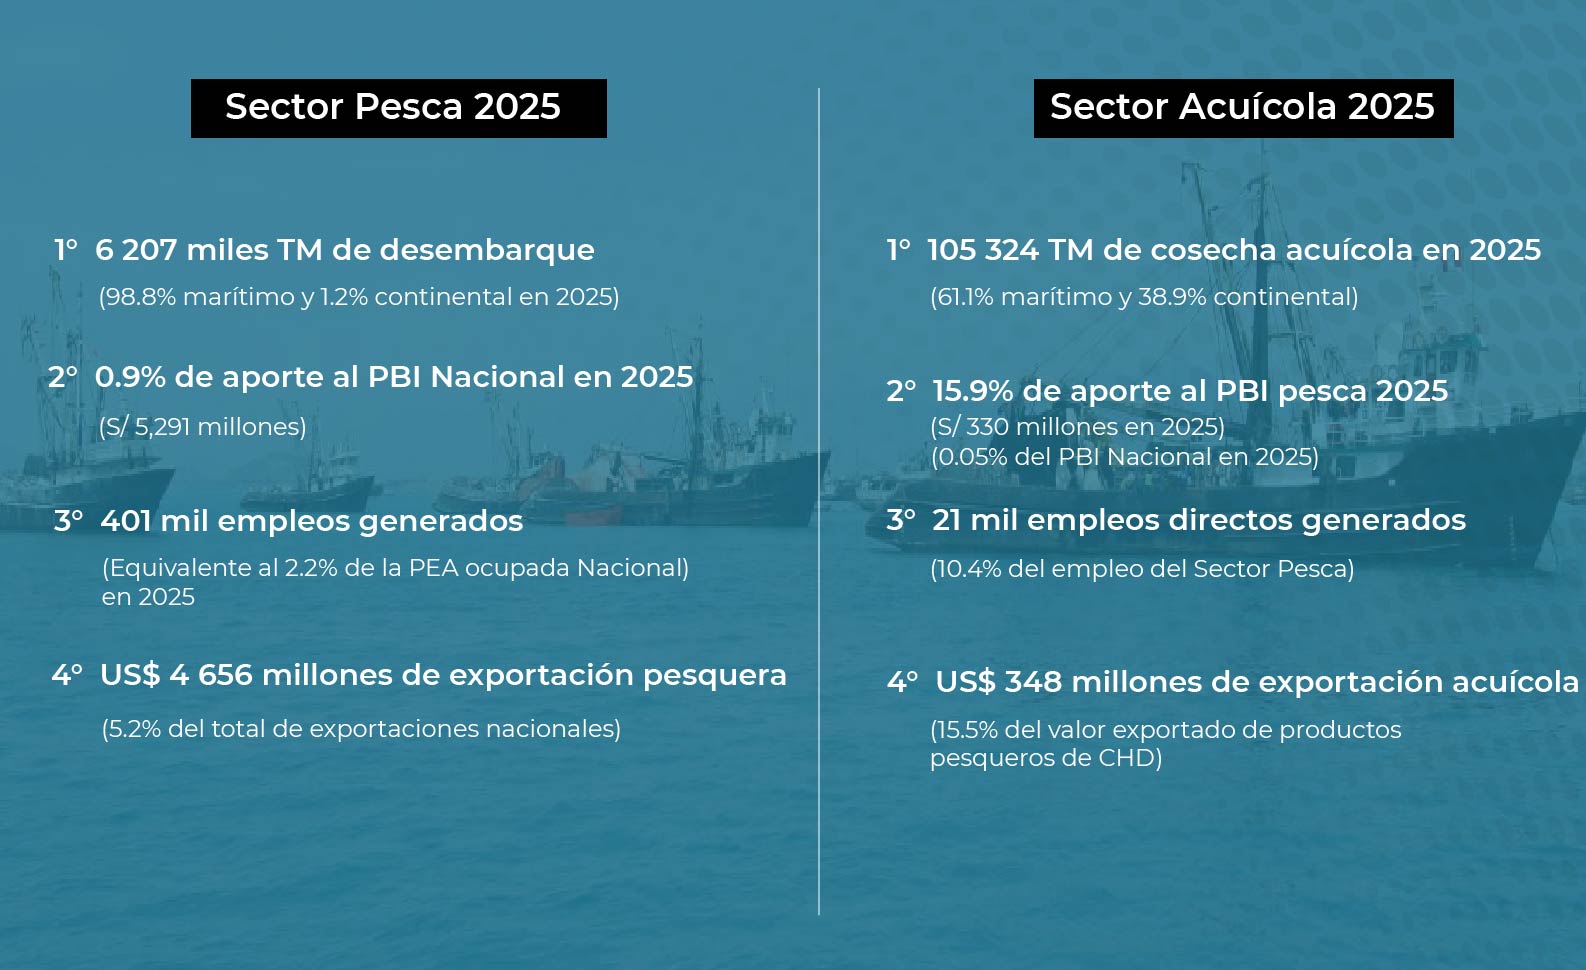
In January 2026, the fishing sector’s GDP contracted by 9.6% year-on-year. This decline was primarily driven by reduced anchovy catches for industrial fishmeal and fish oil production (CHI). In addition, total landings reached 430.4 thousand metric tons, marking a 29.8% decrease compared to January 2025 (613.2 thousand MT).
02
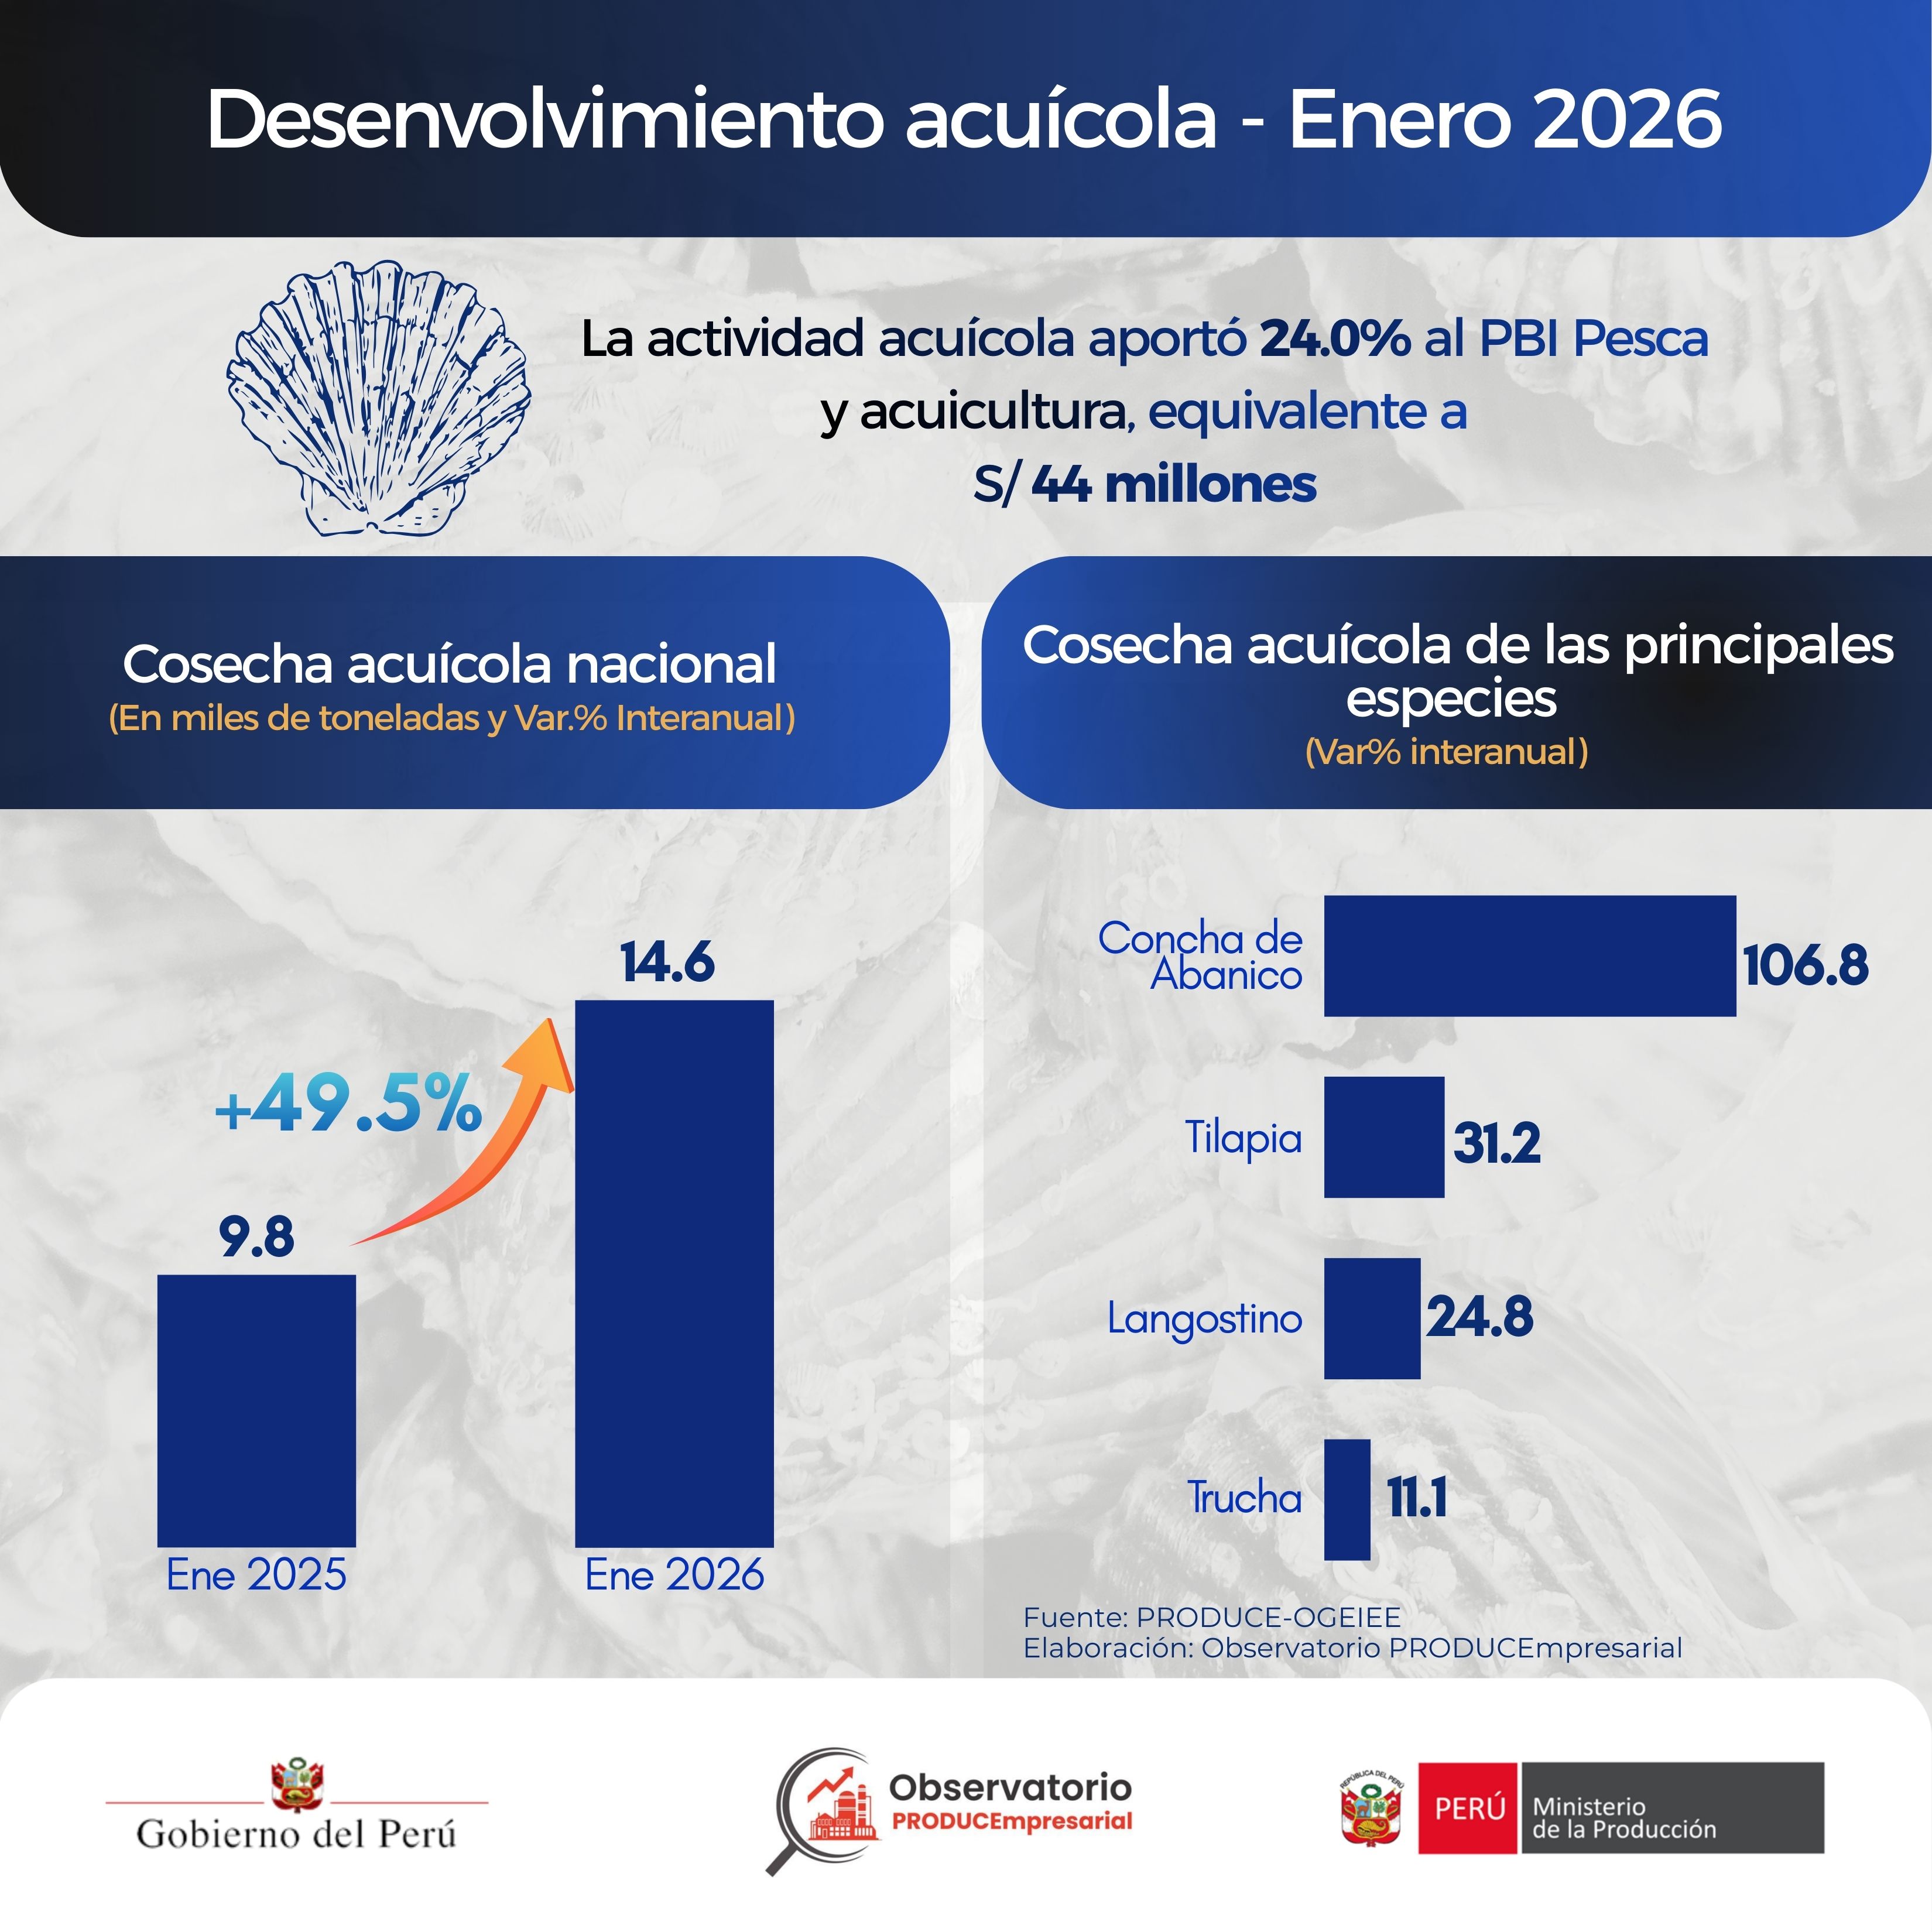
Aquaculture
january 2026
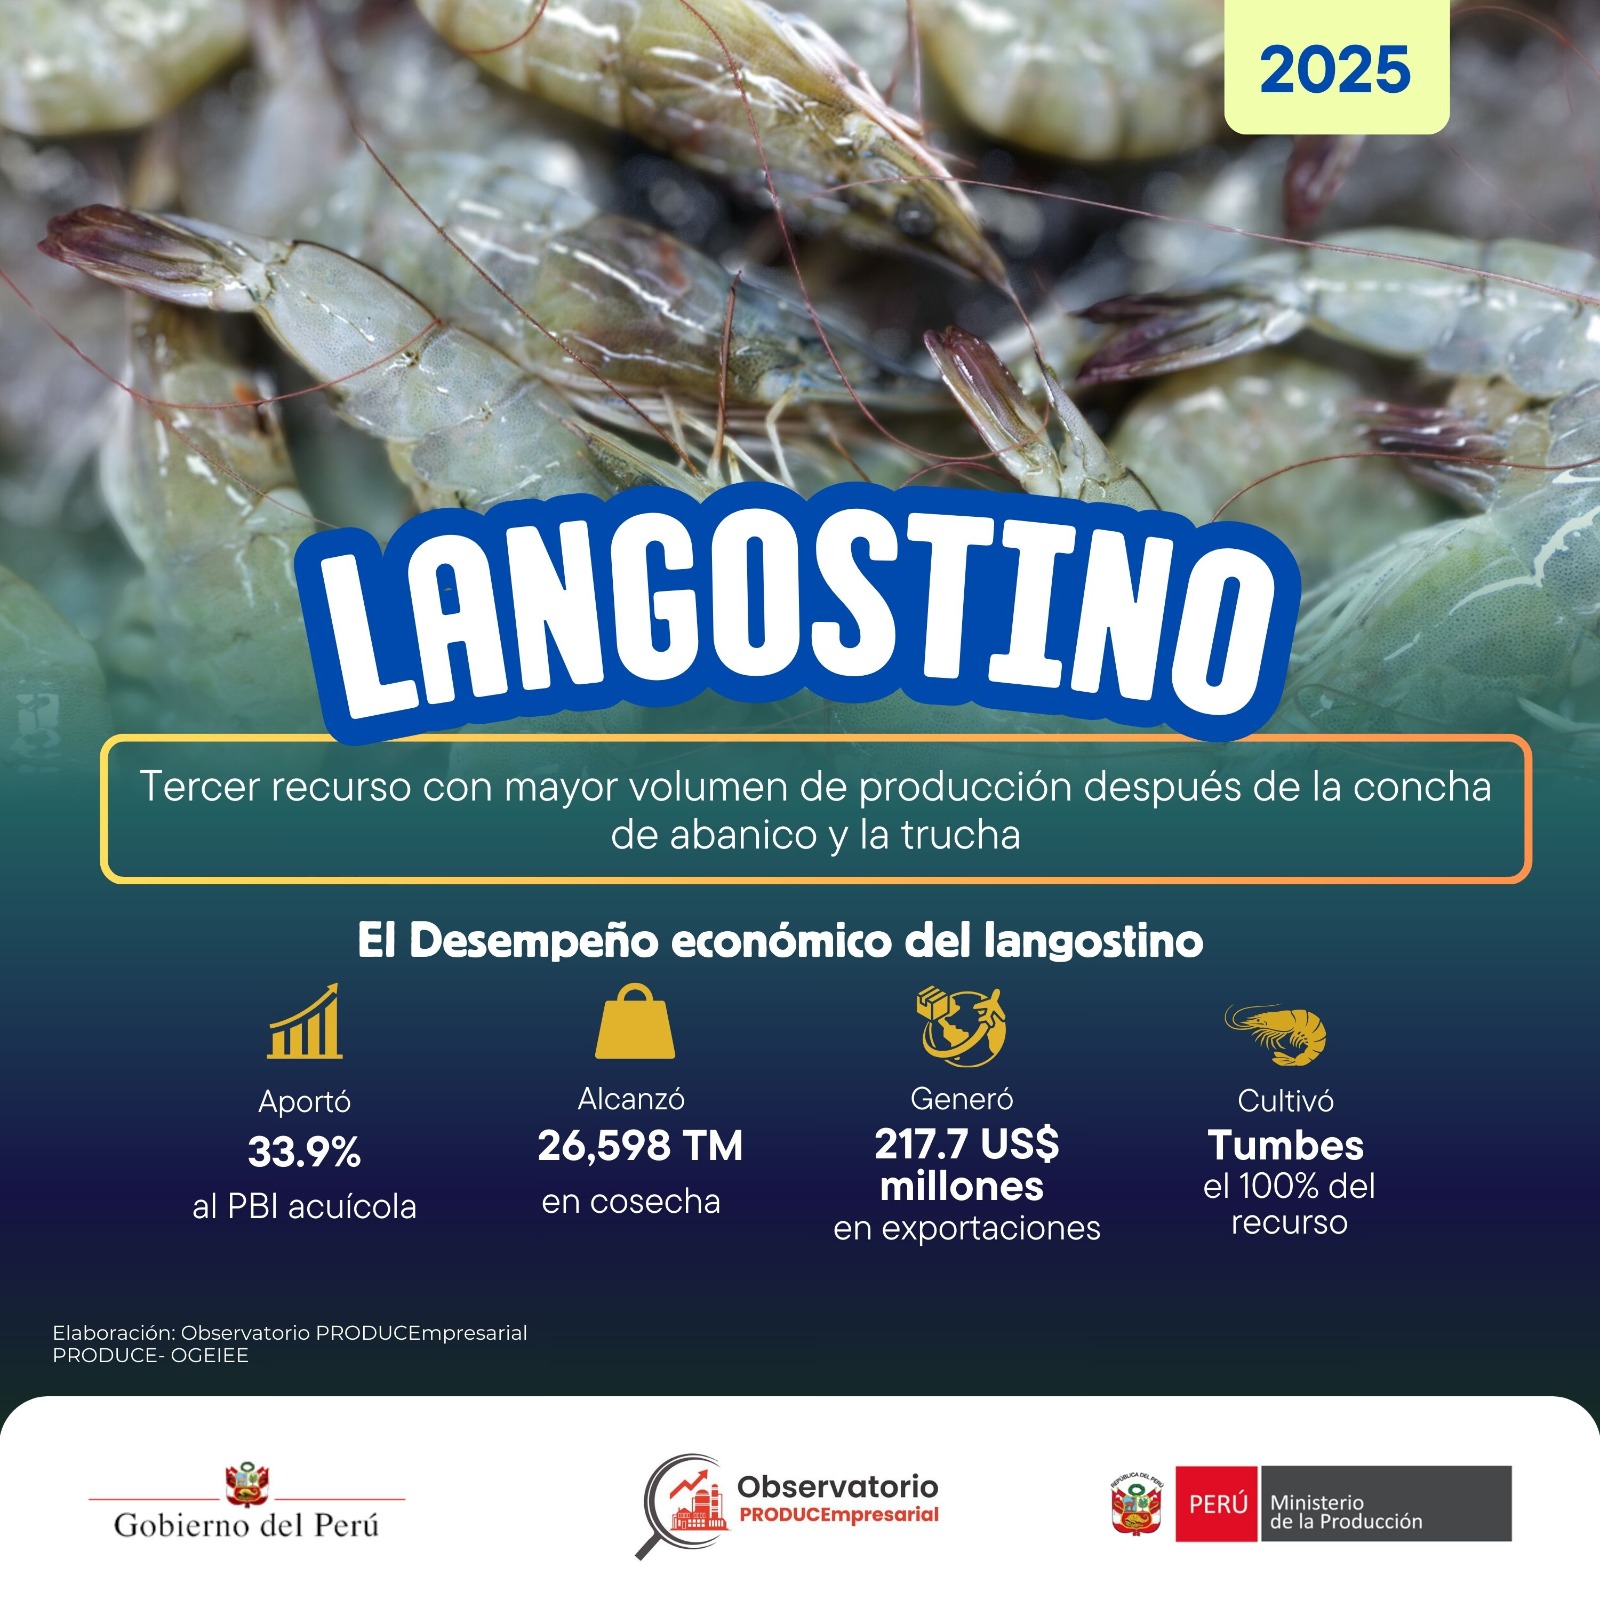
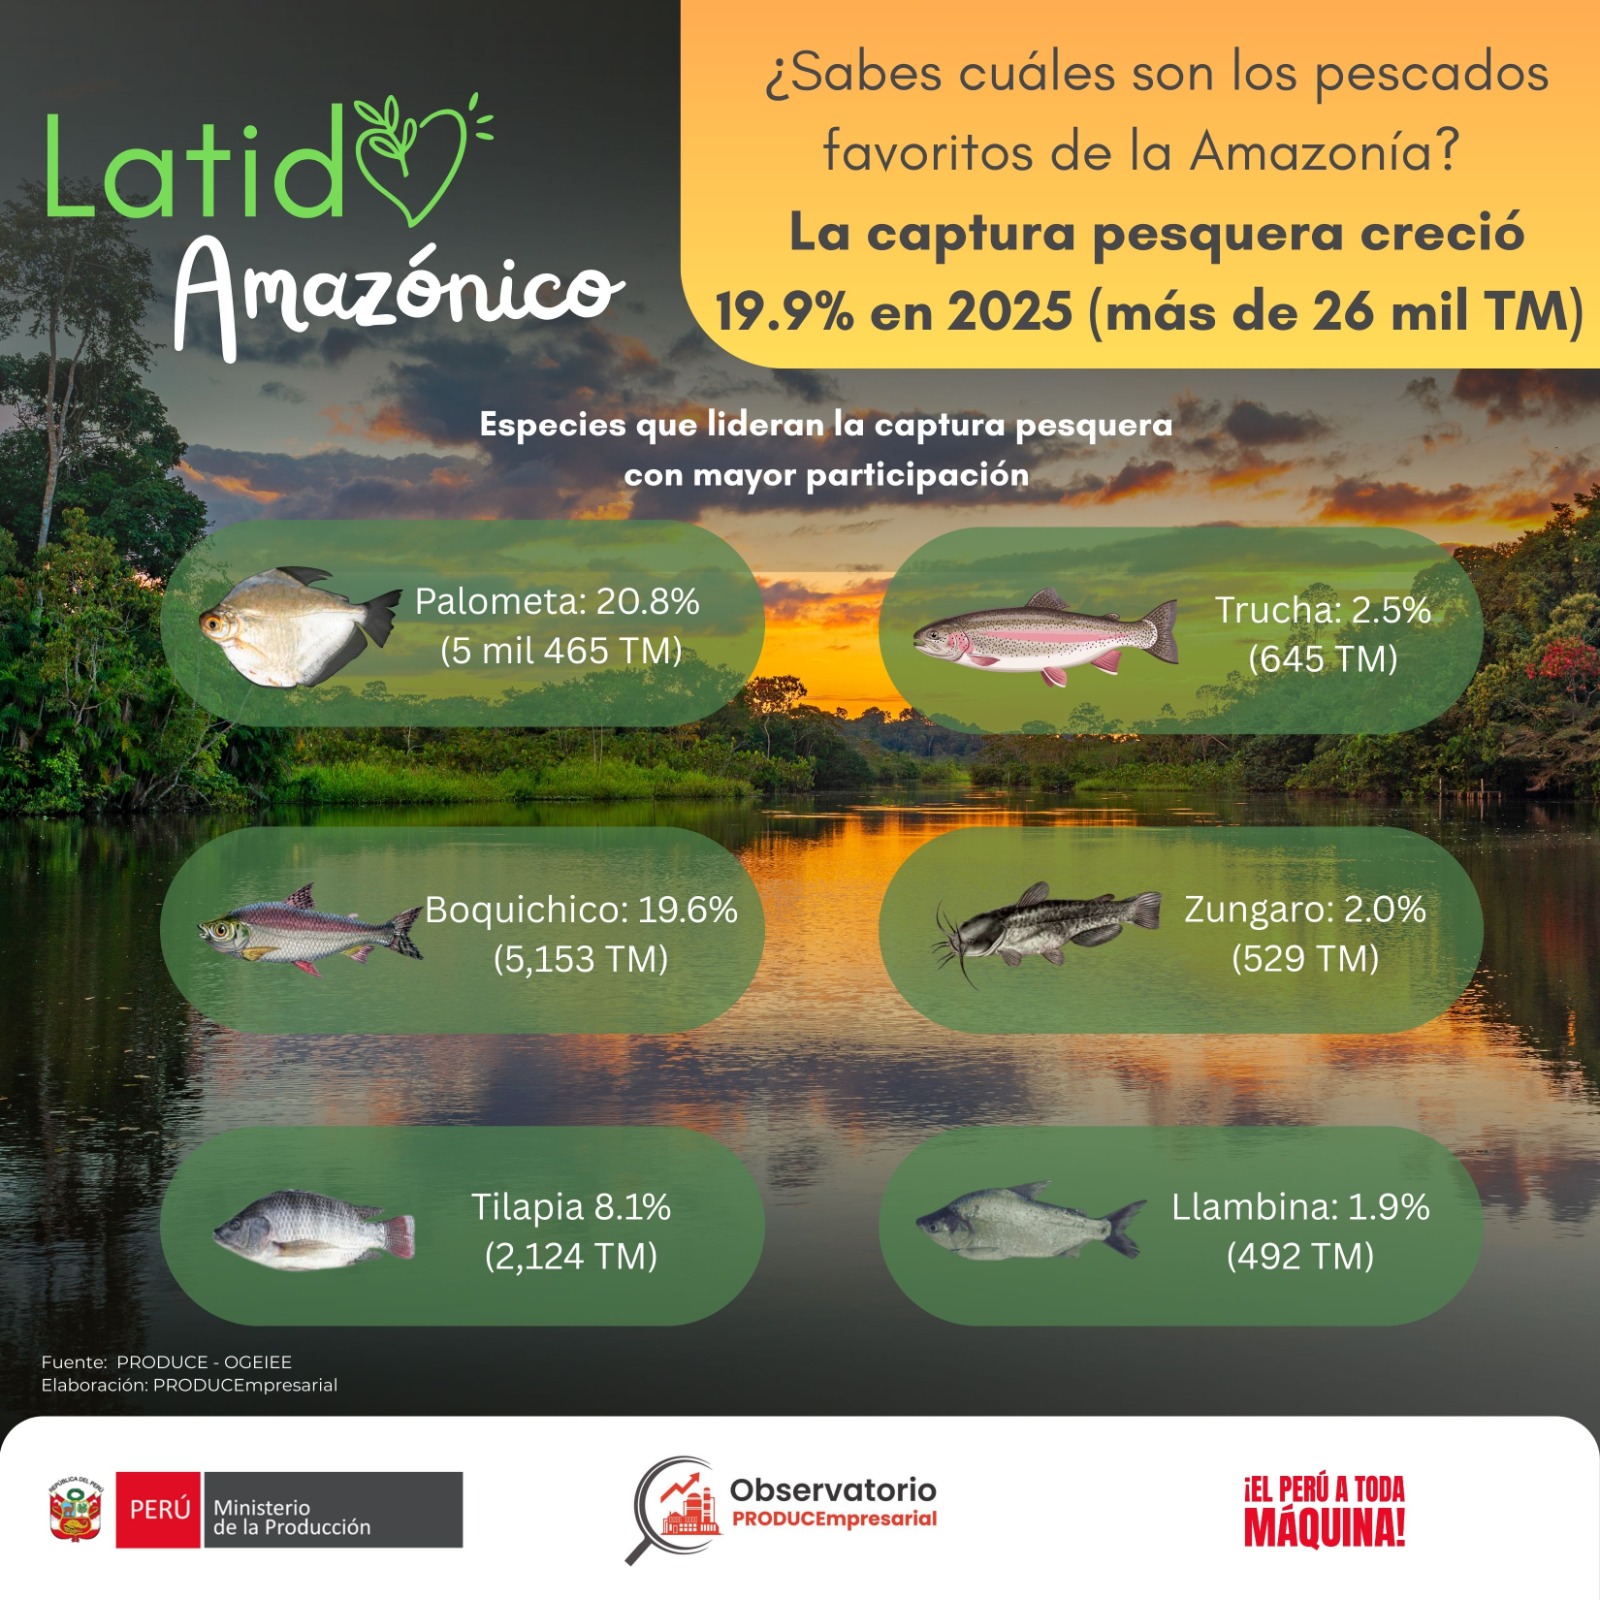
In January 2026, aquaculture harvests expanded by 49.5% year-on-year. This growth was primarily driven by higher harvests of scallops (+106.8%), shrimp (+24.8%), trout (+11.1%), and tilapia (+31.2%), supported by improved weather conditions.
03
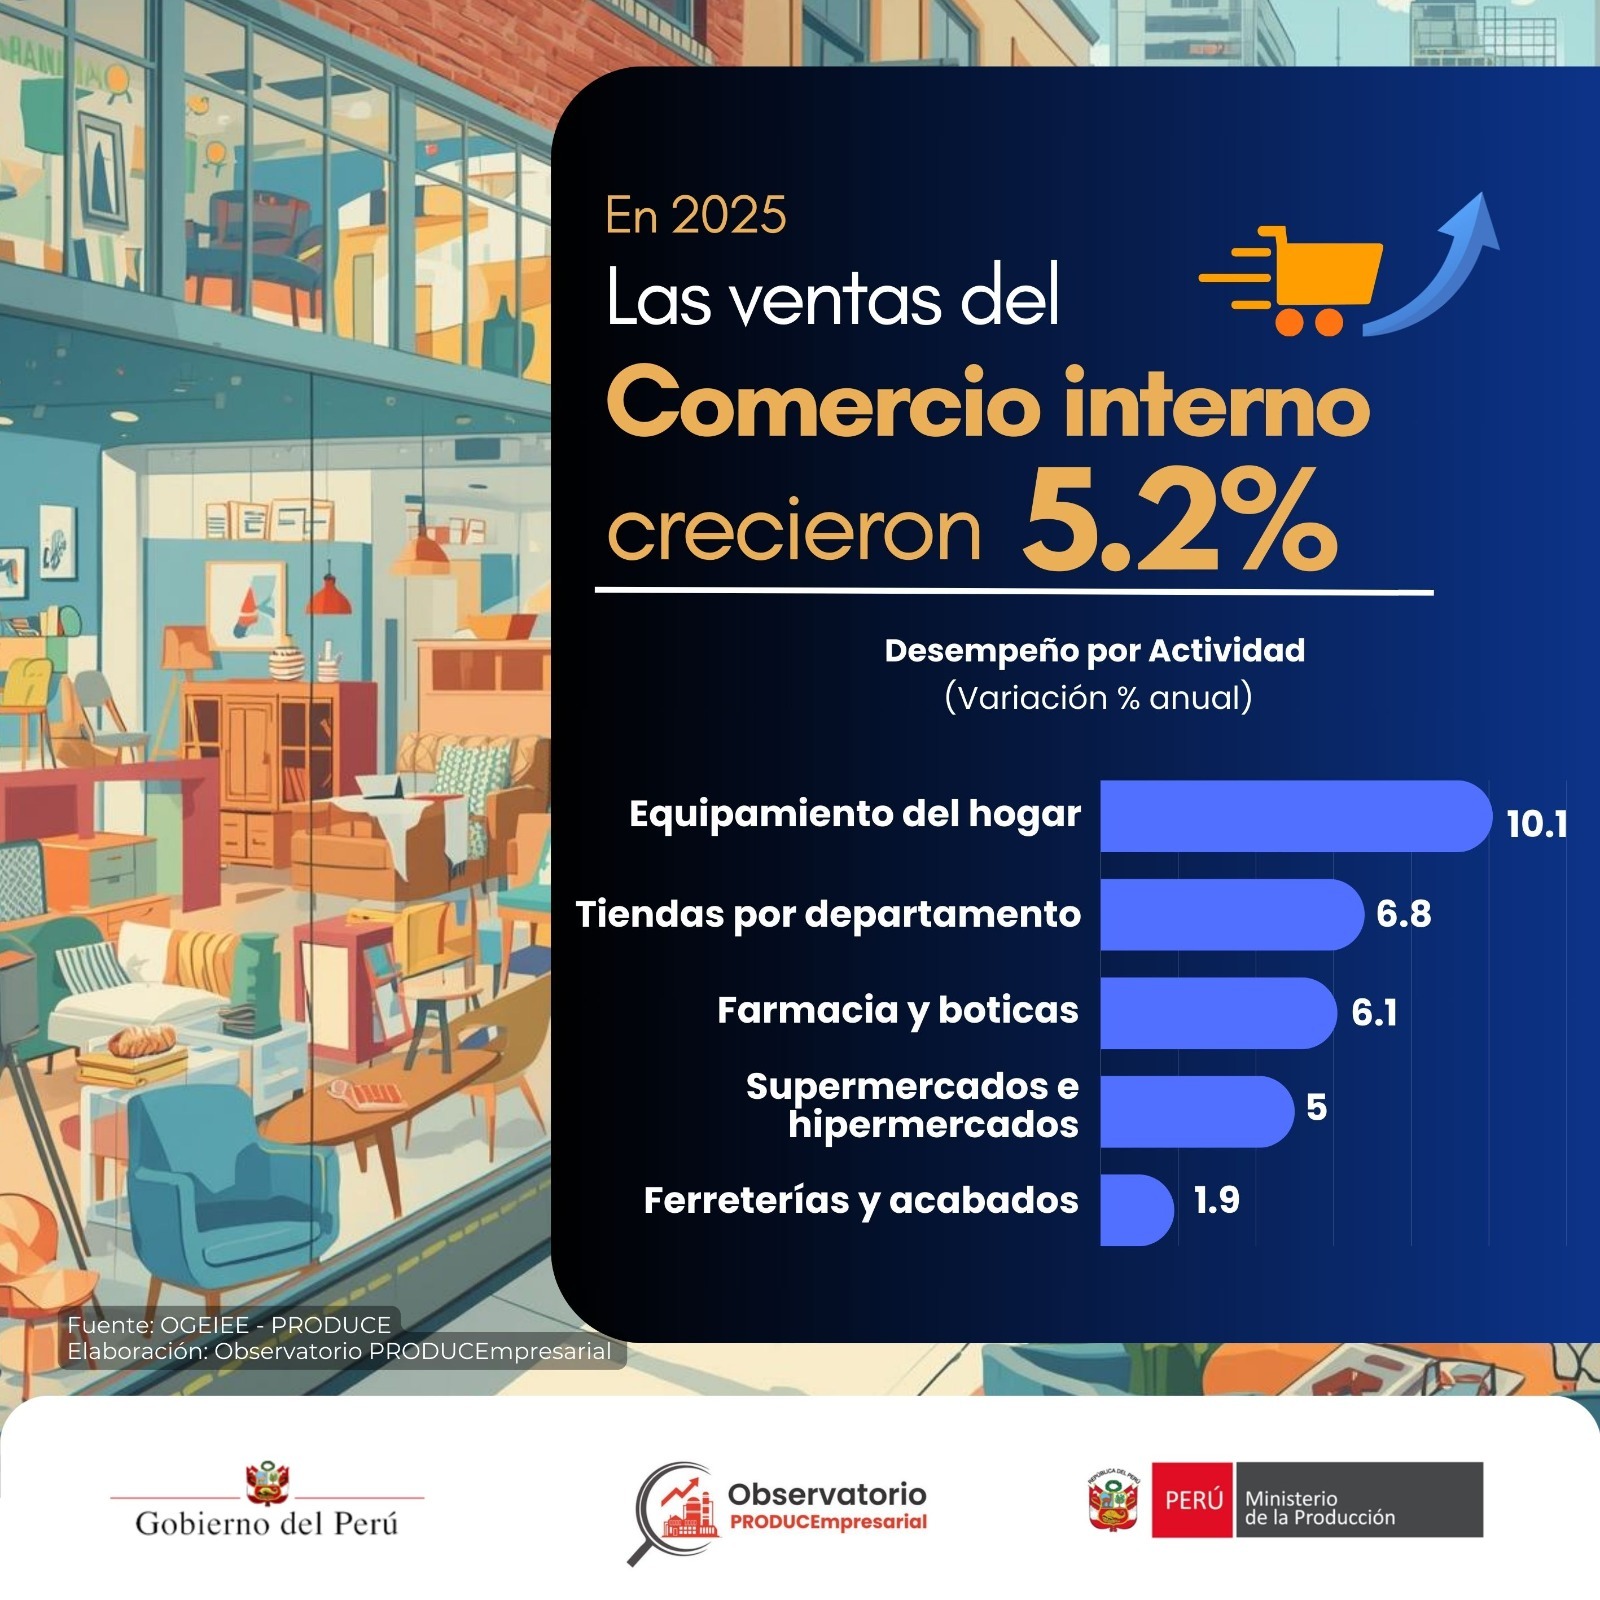
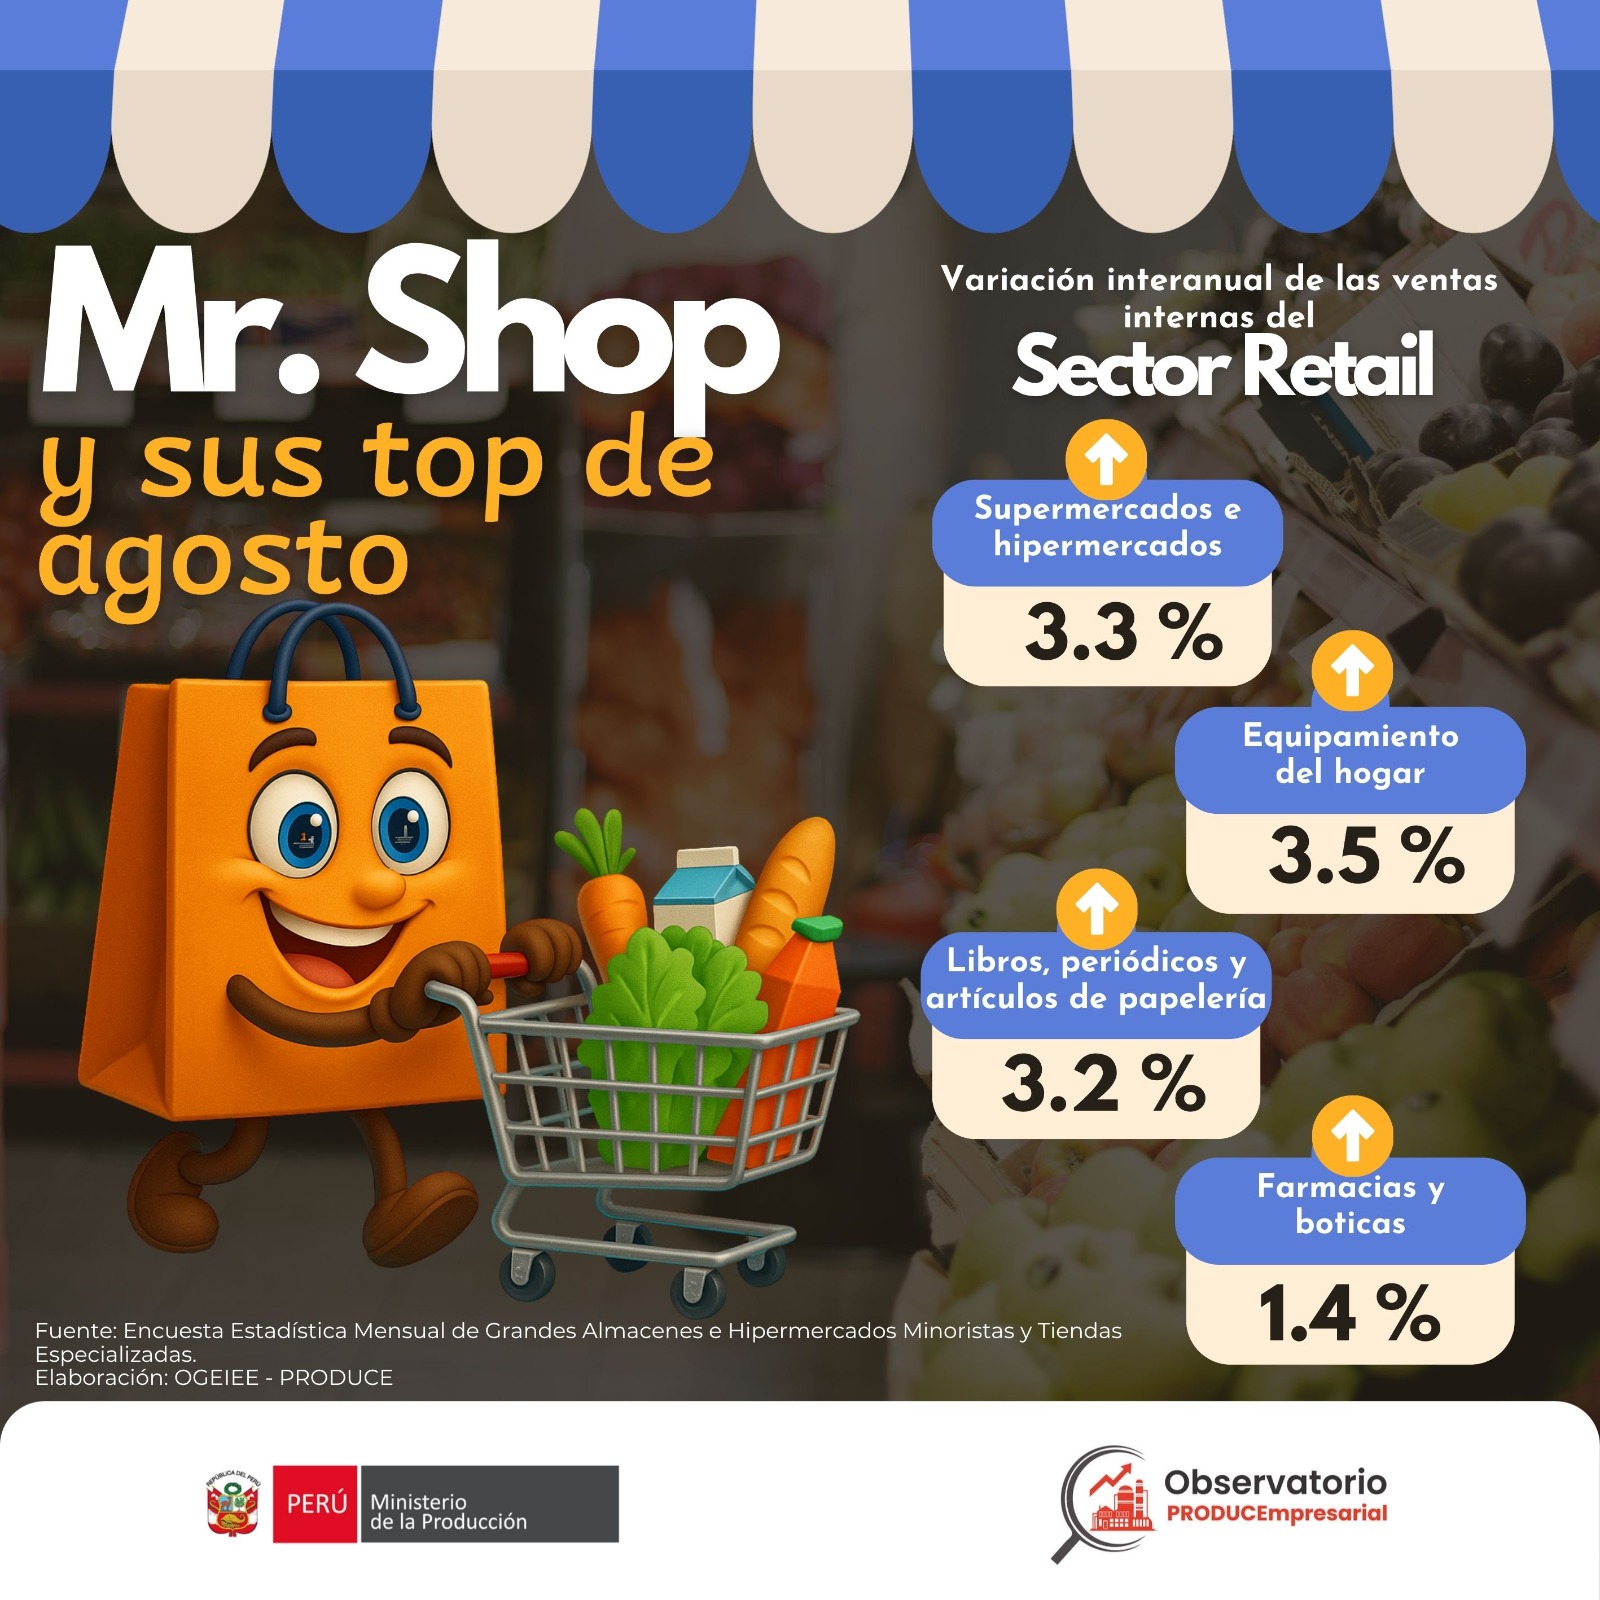
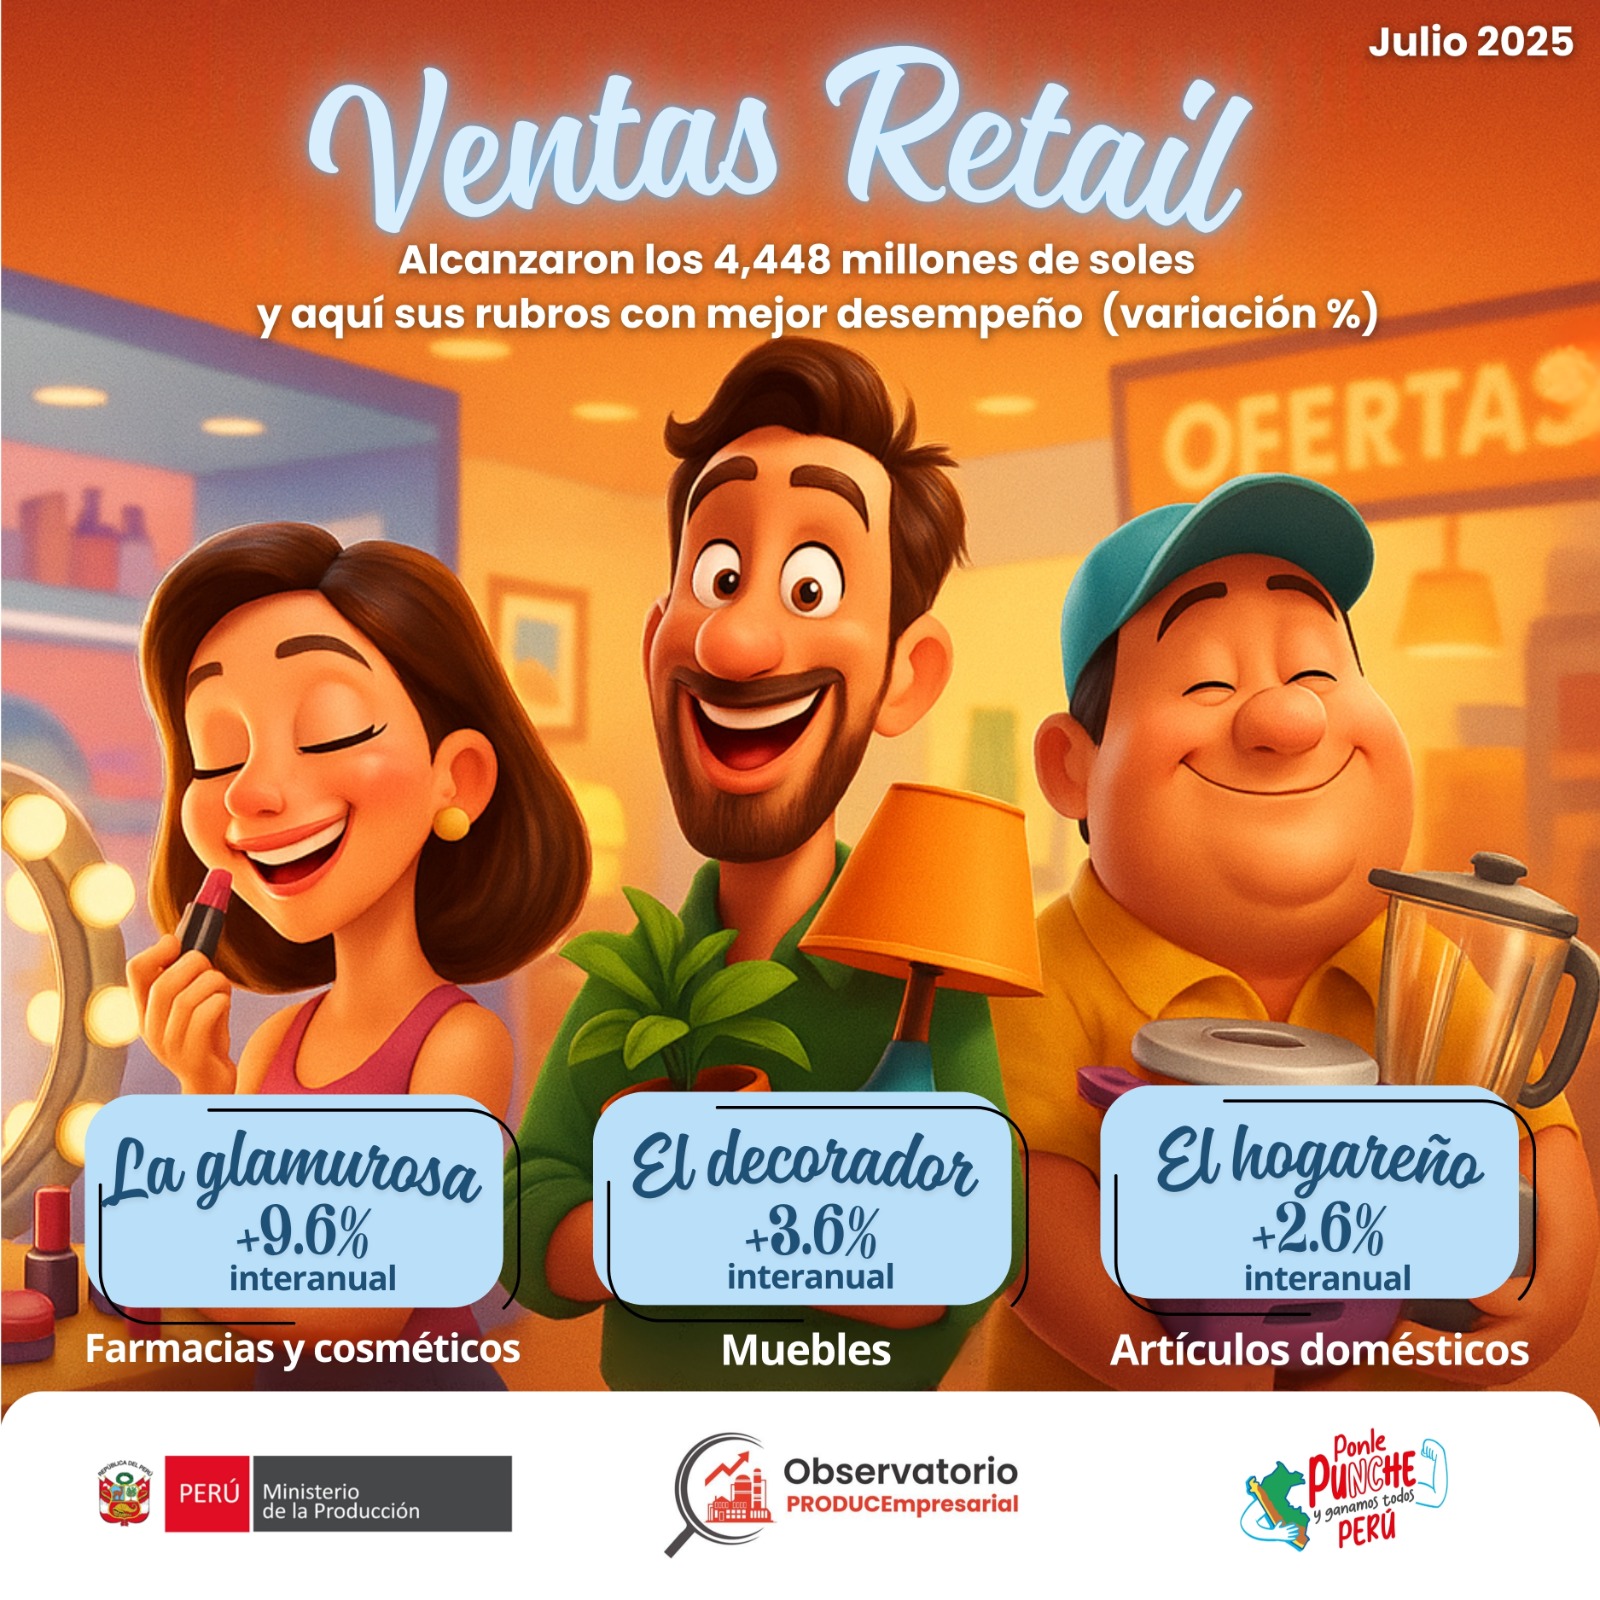
Domestic Trade
january 2026
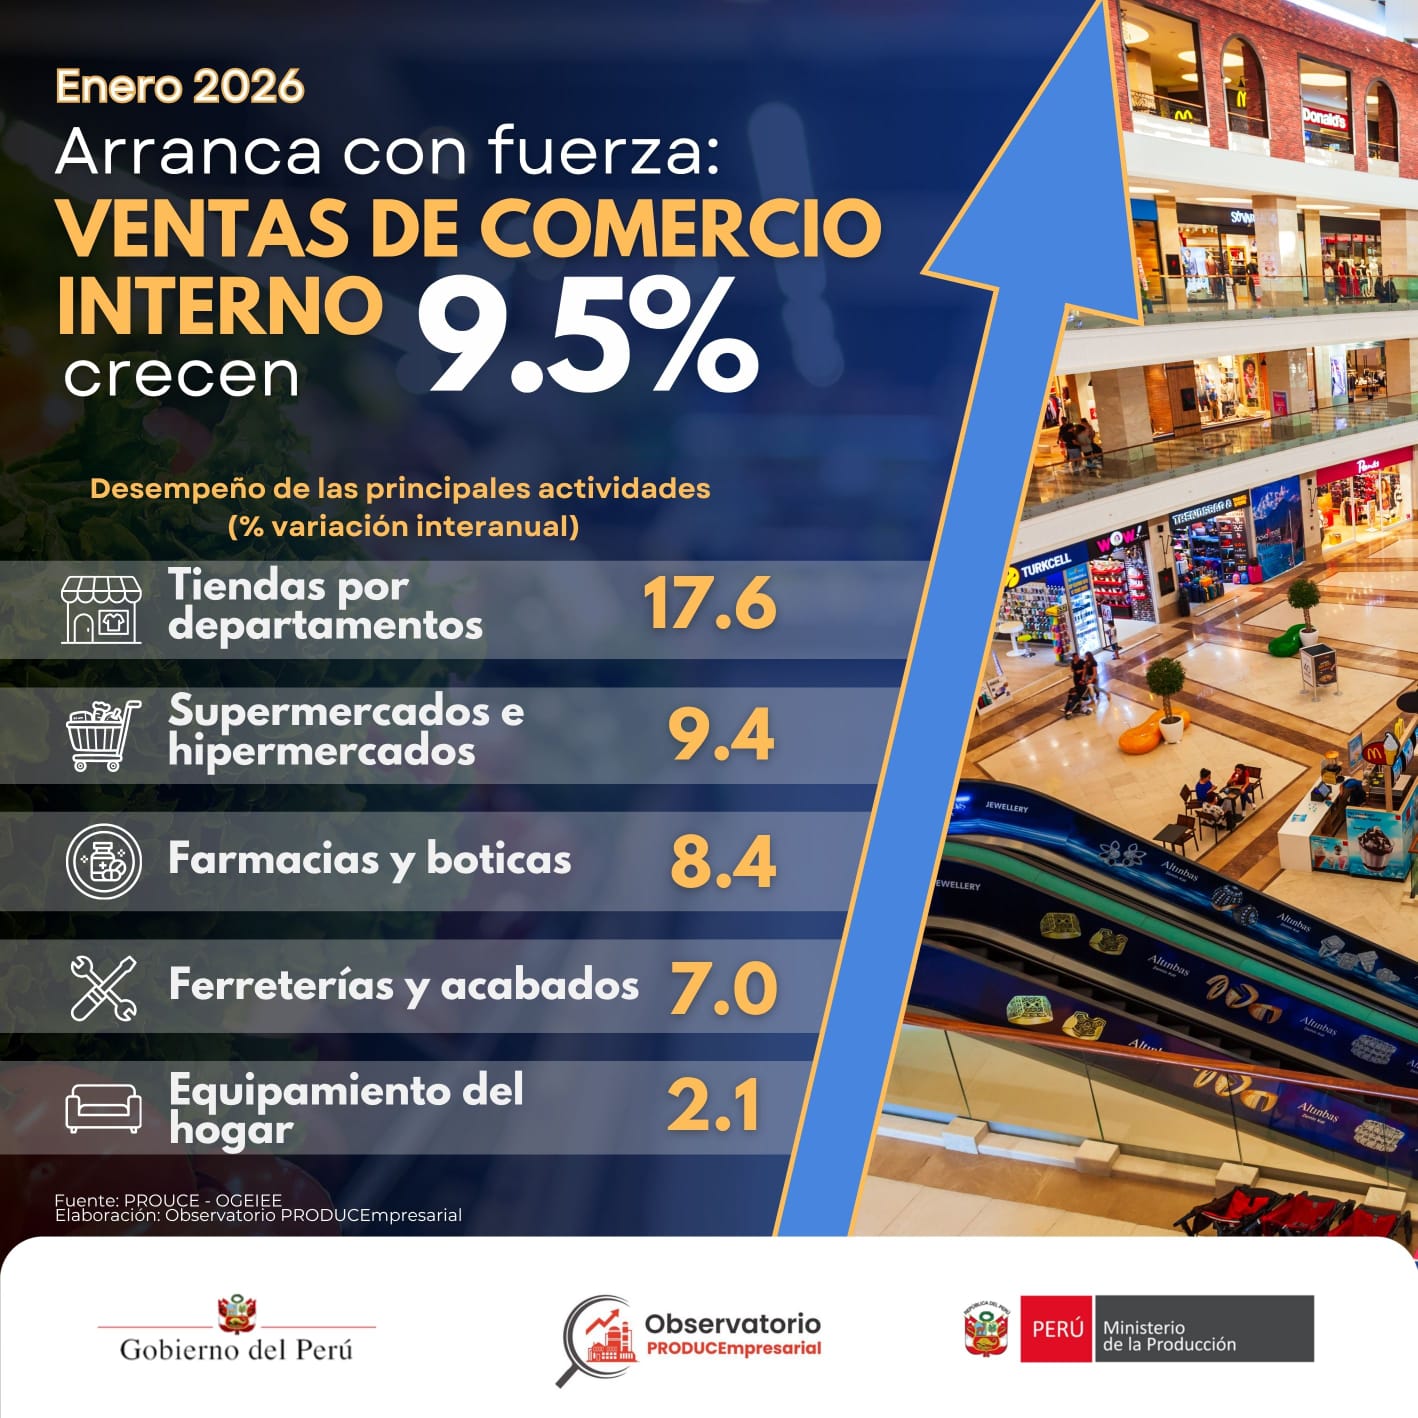
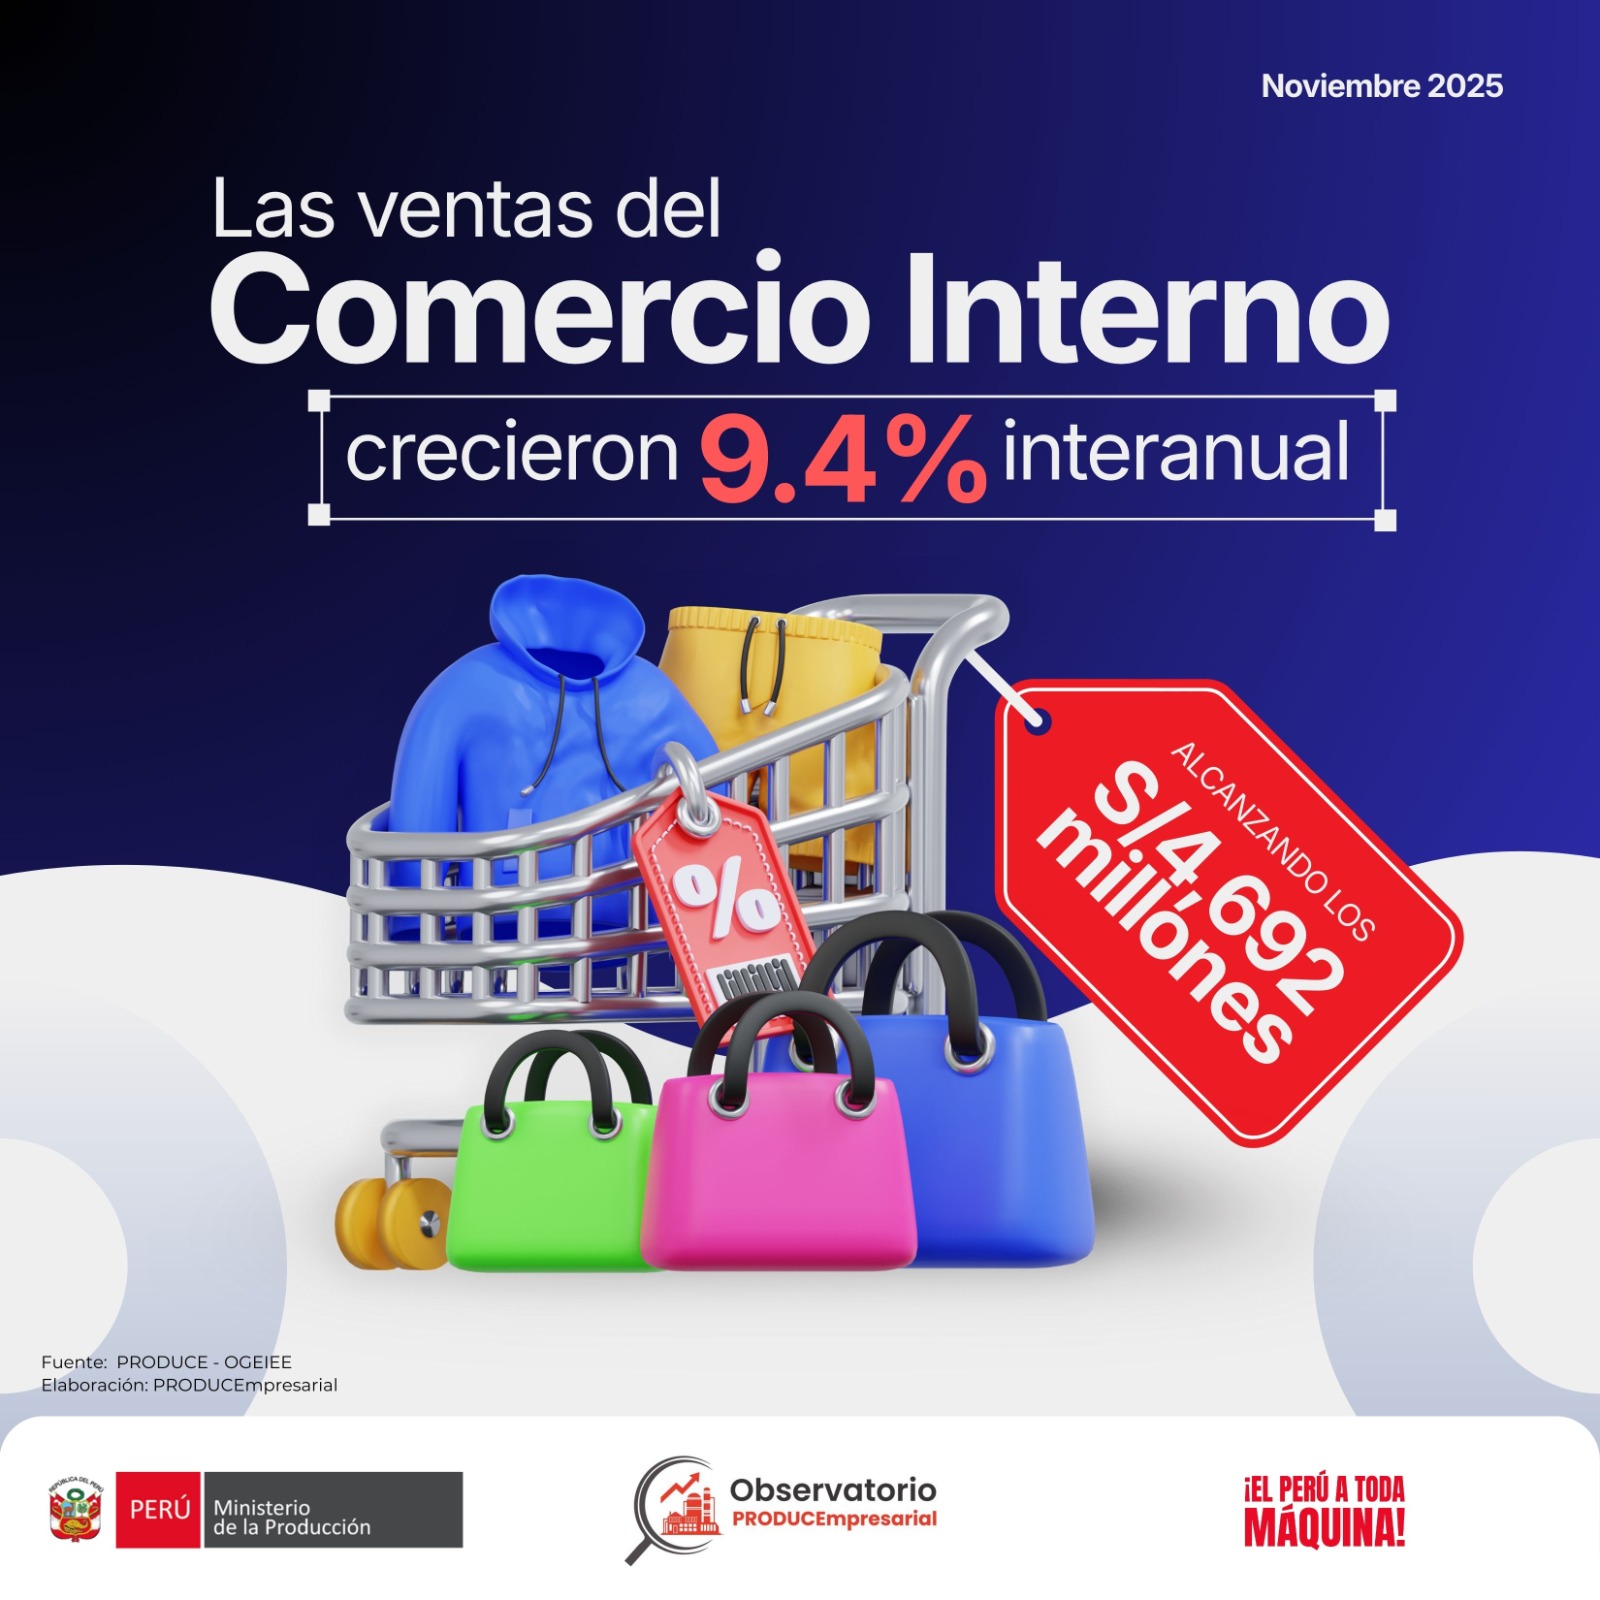
En enero del 2026, las ventas del sector comercio interno crecieron 9.5% respecto a enero de 2025. Este resultado fue impulsado por el aumento en la comercialización de productos básicos y de salud, en un contexto de mayor dinamismo de la demanda interna (+4.9%).
04
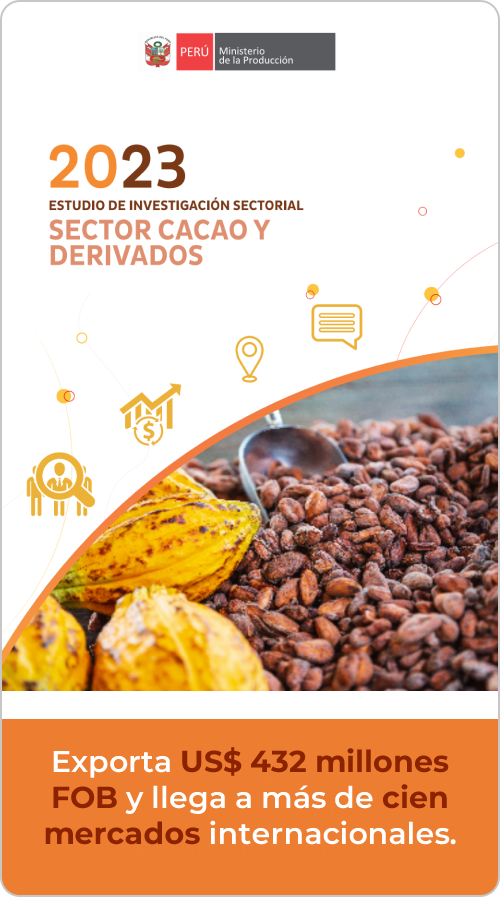
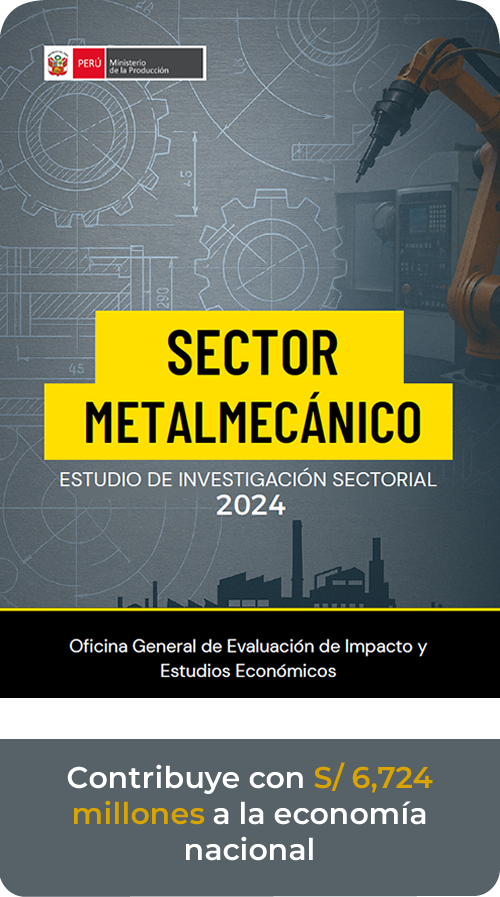
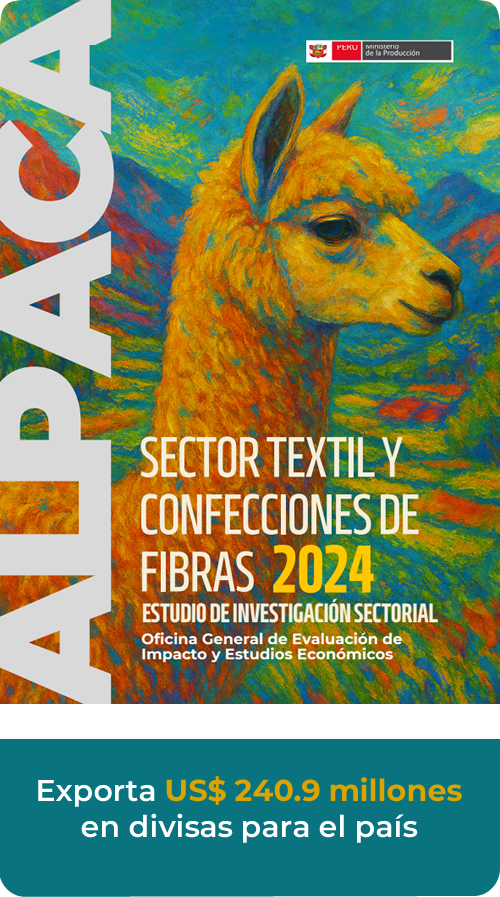
Sectoral Studies
These sectoral studies analyze the performance of an industry at an economic and statistical level, evaluating key indicators such as GDP, employment, and innovation. They are essential for strategic decision-making and the design of policies that promote sectoral growth. We invite you to review them!
05

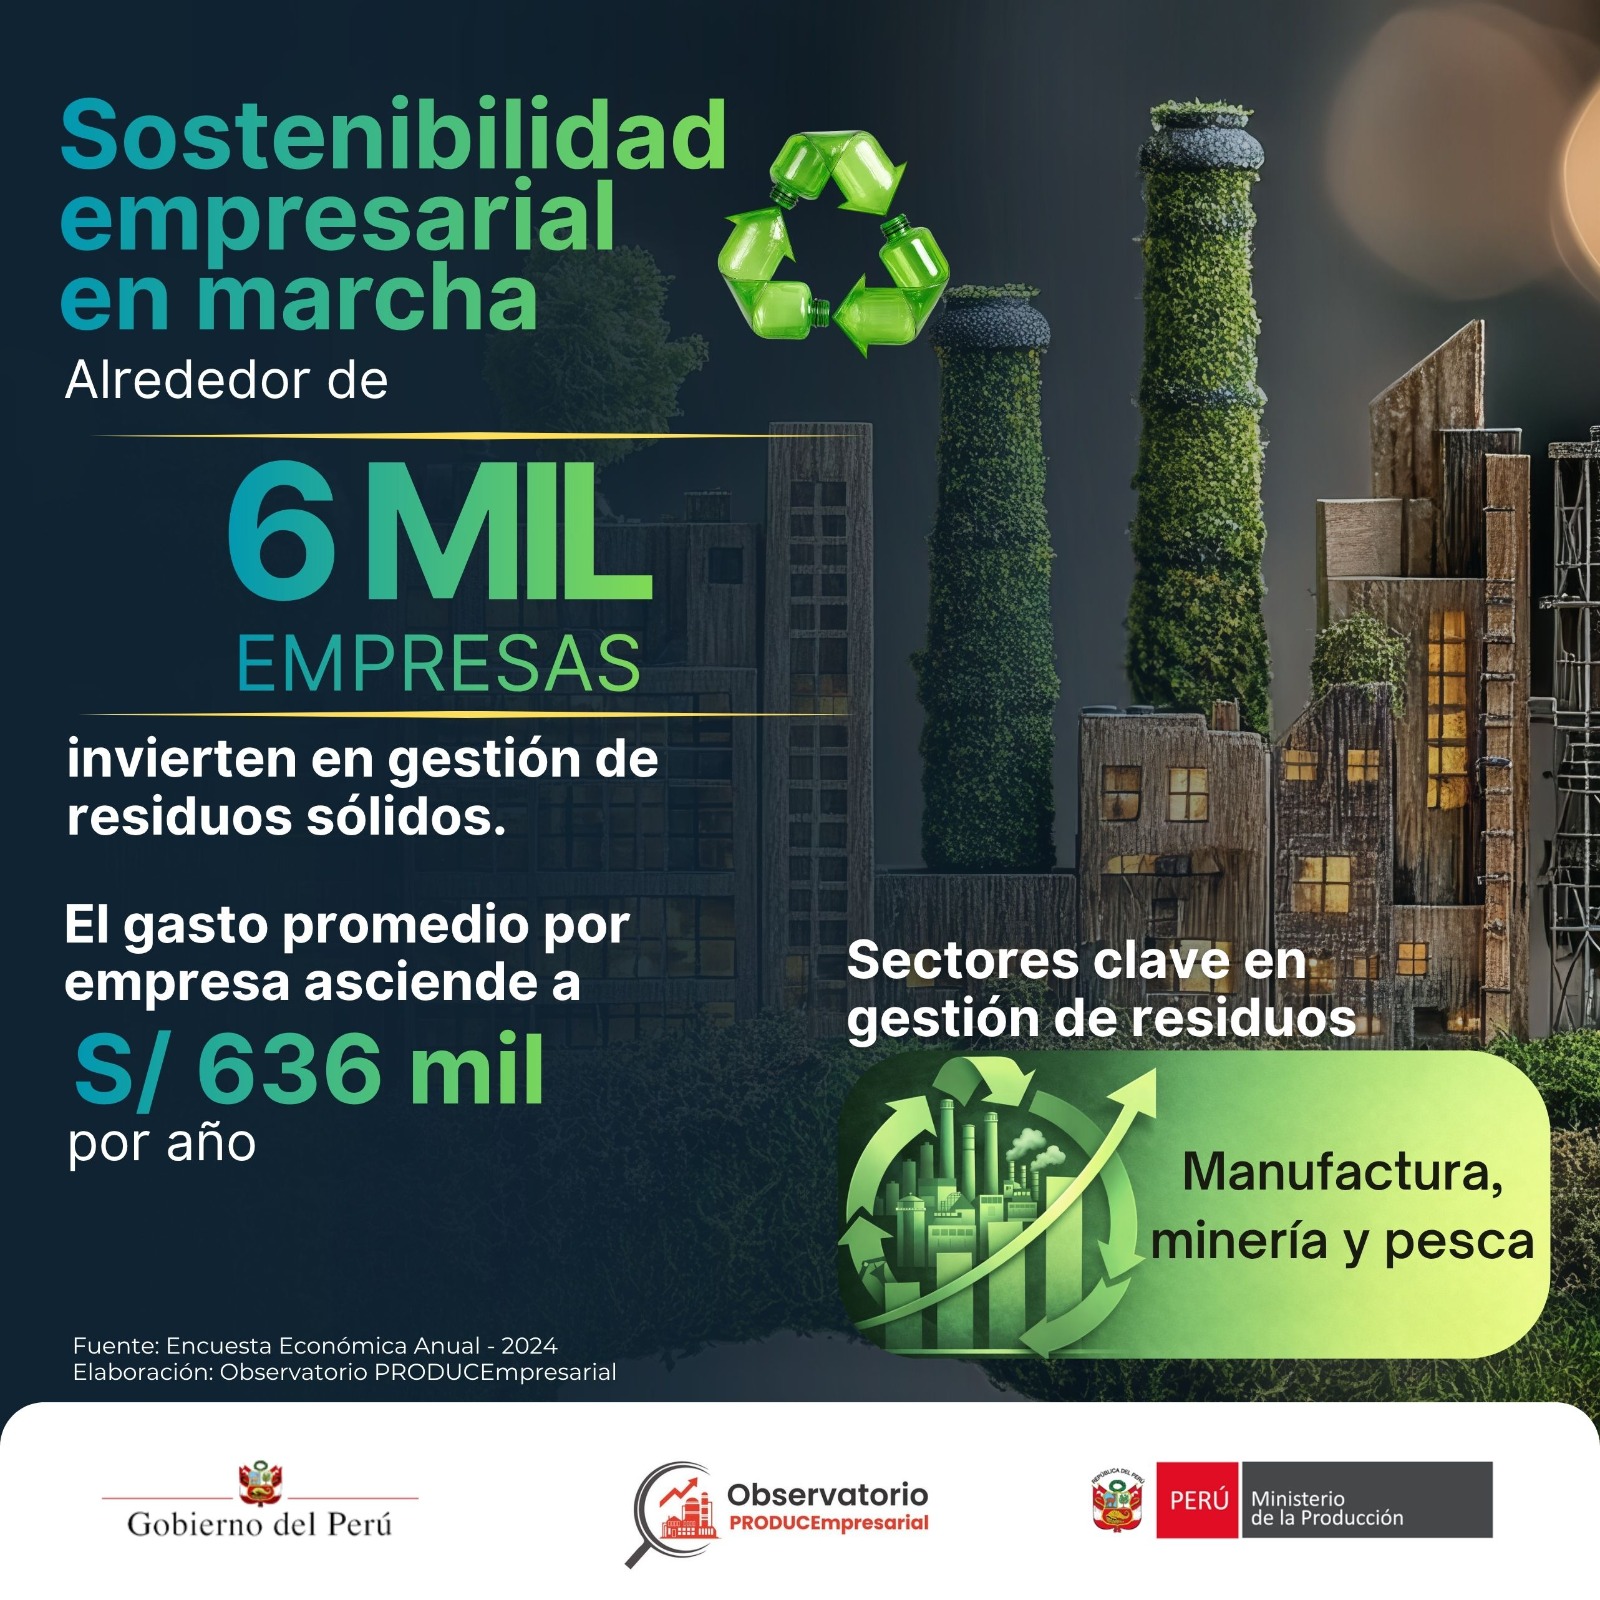
Economía Circular
There are more than 43 mil empresas a nivel nacional implementaron acciones en favor del ambiente.
Economía Circular
Más del 50% de las medianas y grandes empresas industriales que invierten en protección ambiental priorizan la gestión de aguas residuales y la gestión de residuos.

Compartir en:
Compartir en:
Compartir en:
Compartir en:
Compartir en:
Compartir en:
Compartir en:
Compartir en:
Compartir en:
Compartir en:
Compartir en:
Compartir en:
Compartir en:
Compartir en:
Compartir en:
Compartir en:
Compartir en:
Compartir en:
Compartir en:
Compartir en:
Compartir en:
Compartir en:
Compartir en:
Compartir en:
Compartir en:
Compartir en:
Compartir en:
Compartir en:
Compartir en:
Compartir en:
Compartir en:
Compartir en:

Compartir en:
Compartir en:
Compartir en:
Compartir en:
Compartir en:
Compartir en:
Compartir en:
Compartir en:
Compartir en:
Compartir en:
Compartir en:
Compartir en:
Compartir en:
Compartir en:
Compartir en:
Compartir en:
Compartir en:
Compartir en:

Compartir en:
Compartir en:
Compartir en:
Compartir en:
Compartir en:
Compartir en:
Compartir en:
Compartir en:
Compartir en:
Compartir en:
Compartir en:
Compartir en:
Compartir en:
Compartir en:
Compartir en:
Compartir en:

Compartir en:
Compartir en:
Compartir en:
Compartir en:
Compartir en:
Compartir en:
Compartir en:
Compartir en:
Compartir en:
Compartir en:
Compartir en:
Compartir en:
Compartir en:
Compartir en:
Compartir en:
Compartir en:
Compartir en:
Compartir en:

Compartir en:
Compartir en:
Compartir en:
Compartir en:
Compartir en:
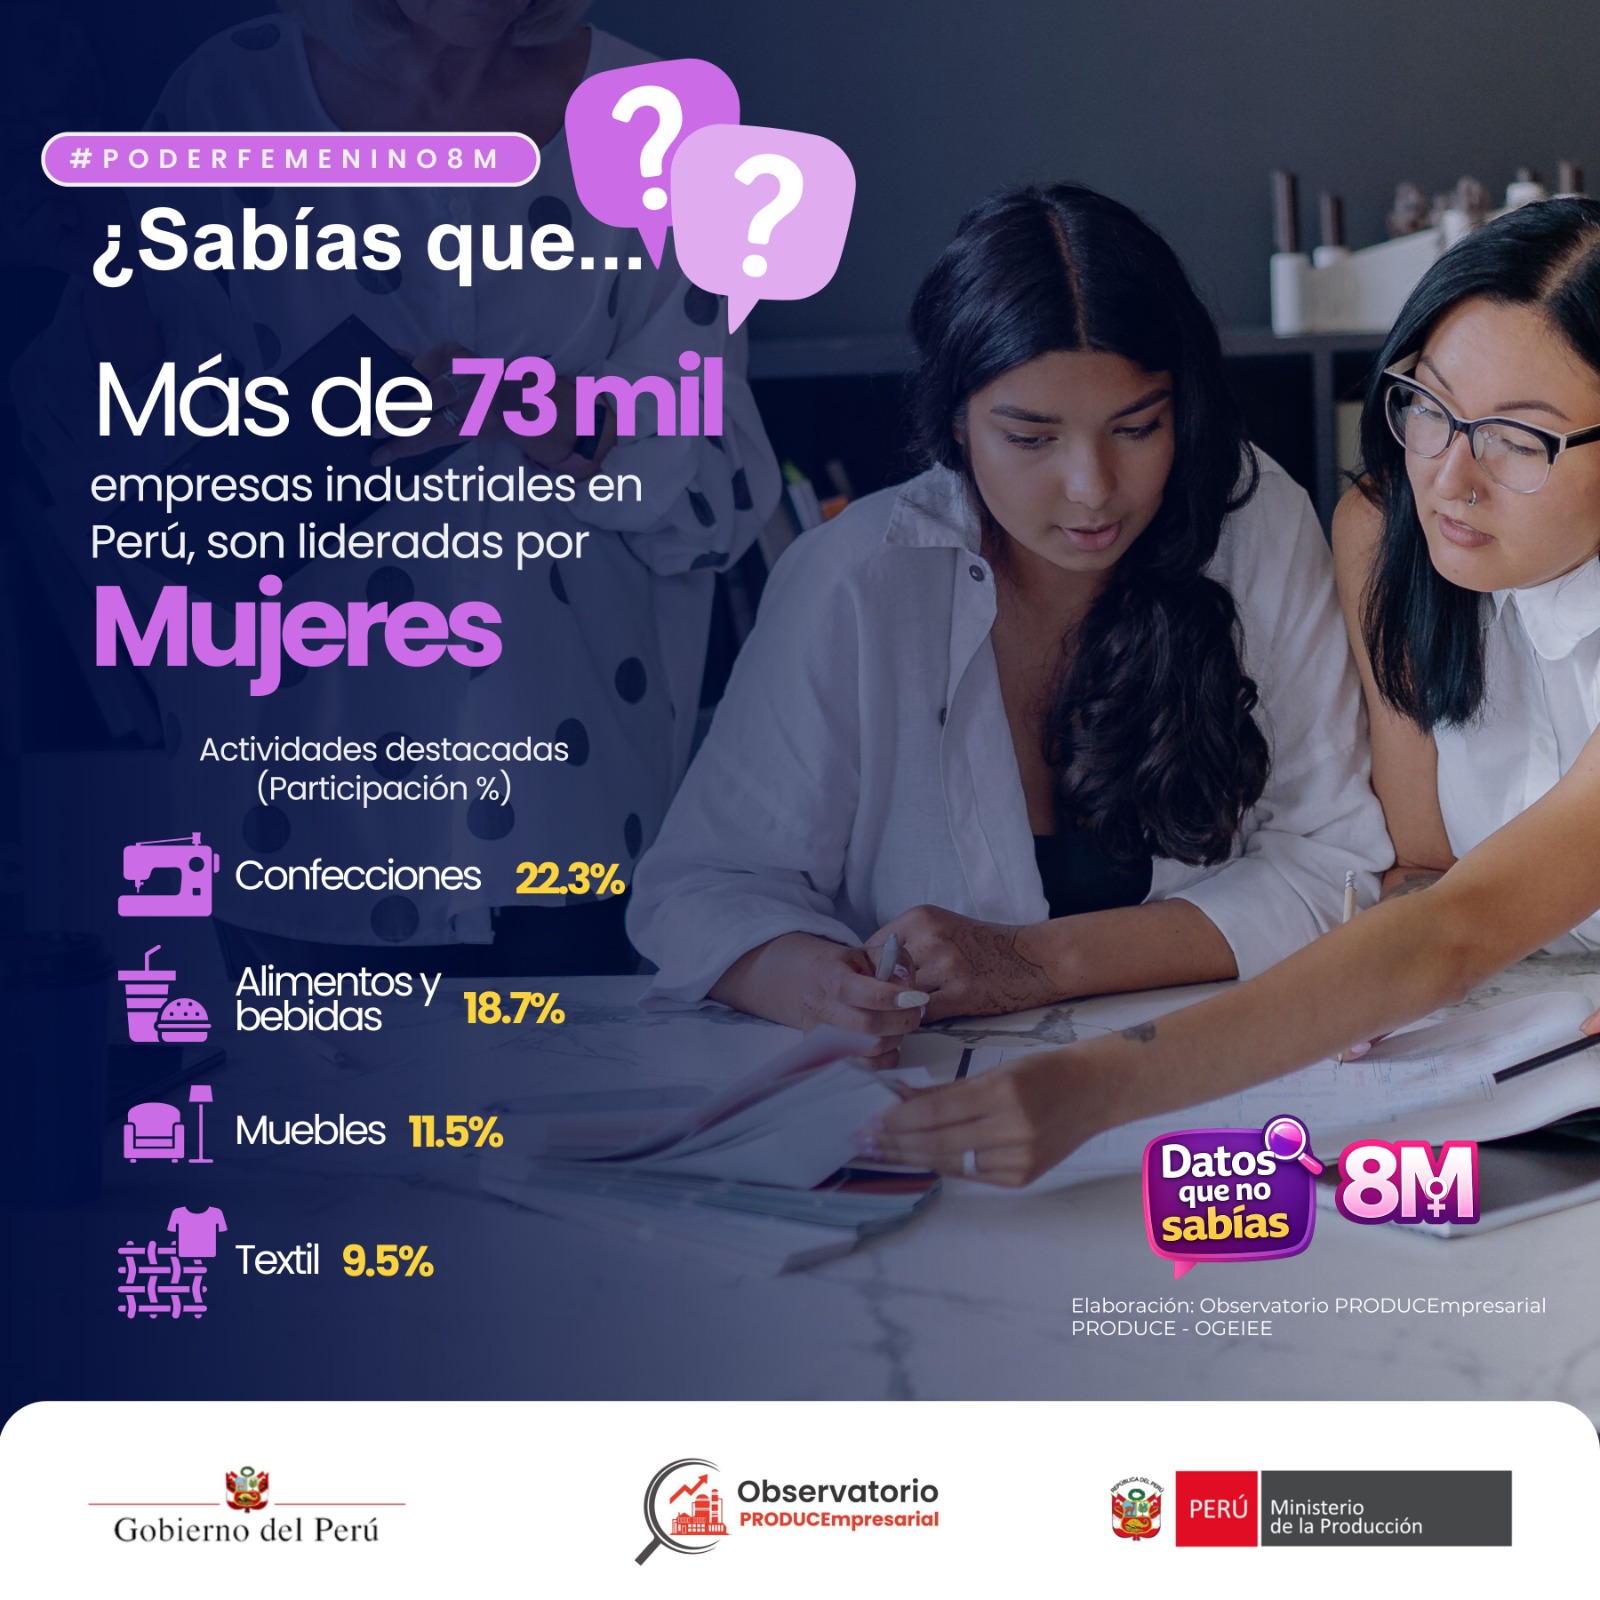
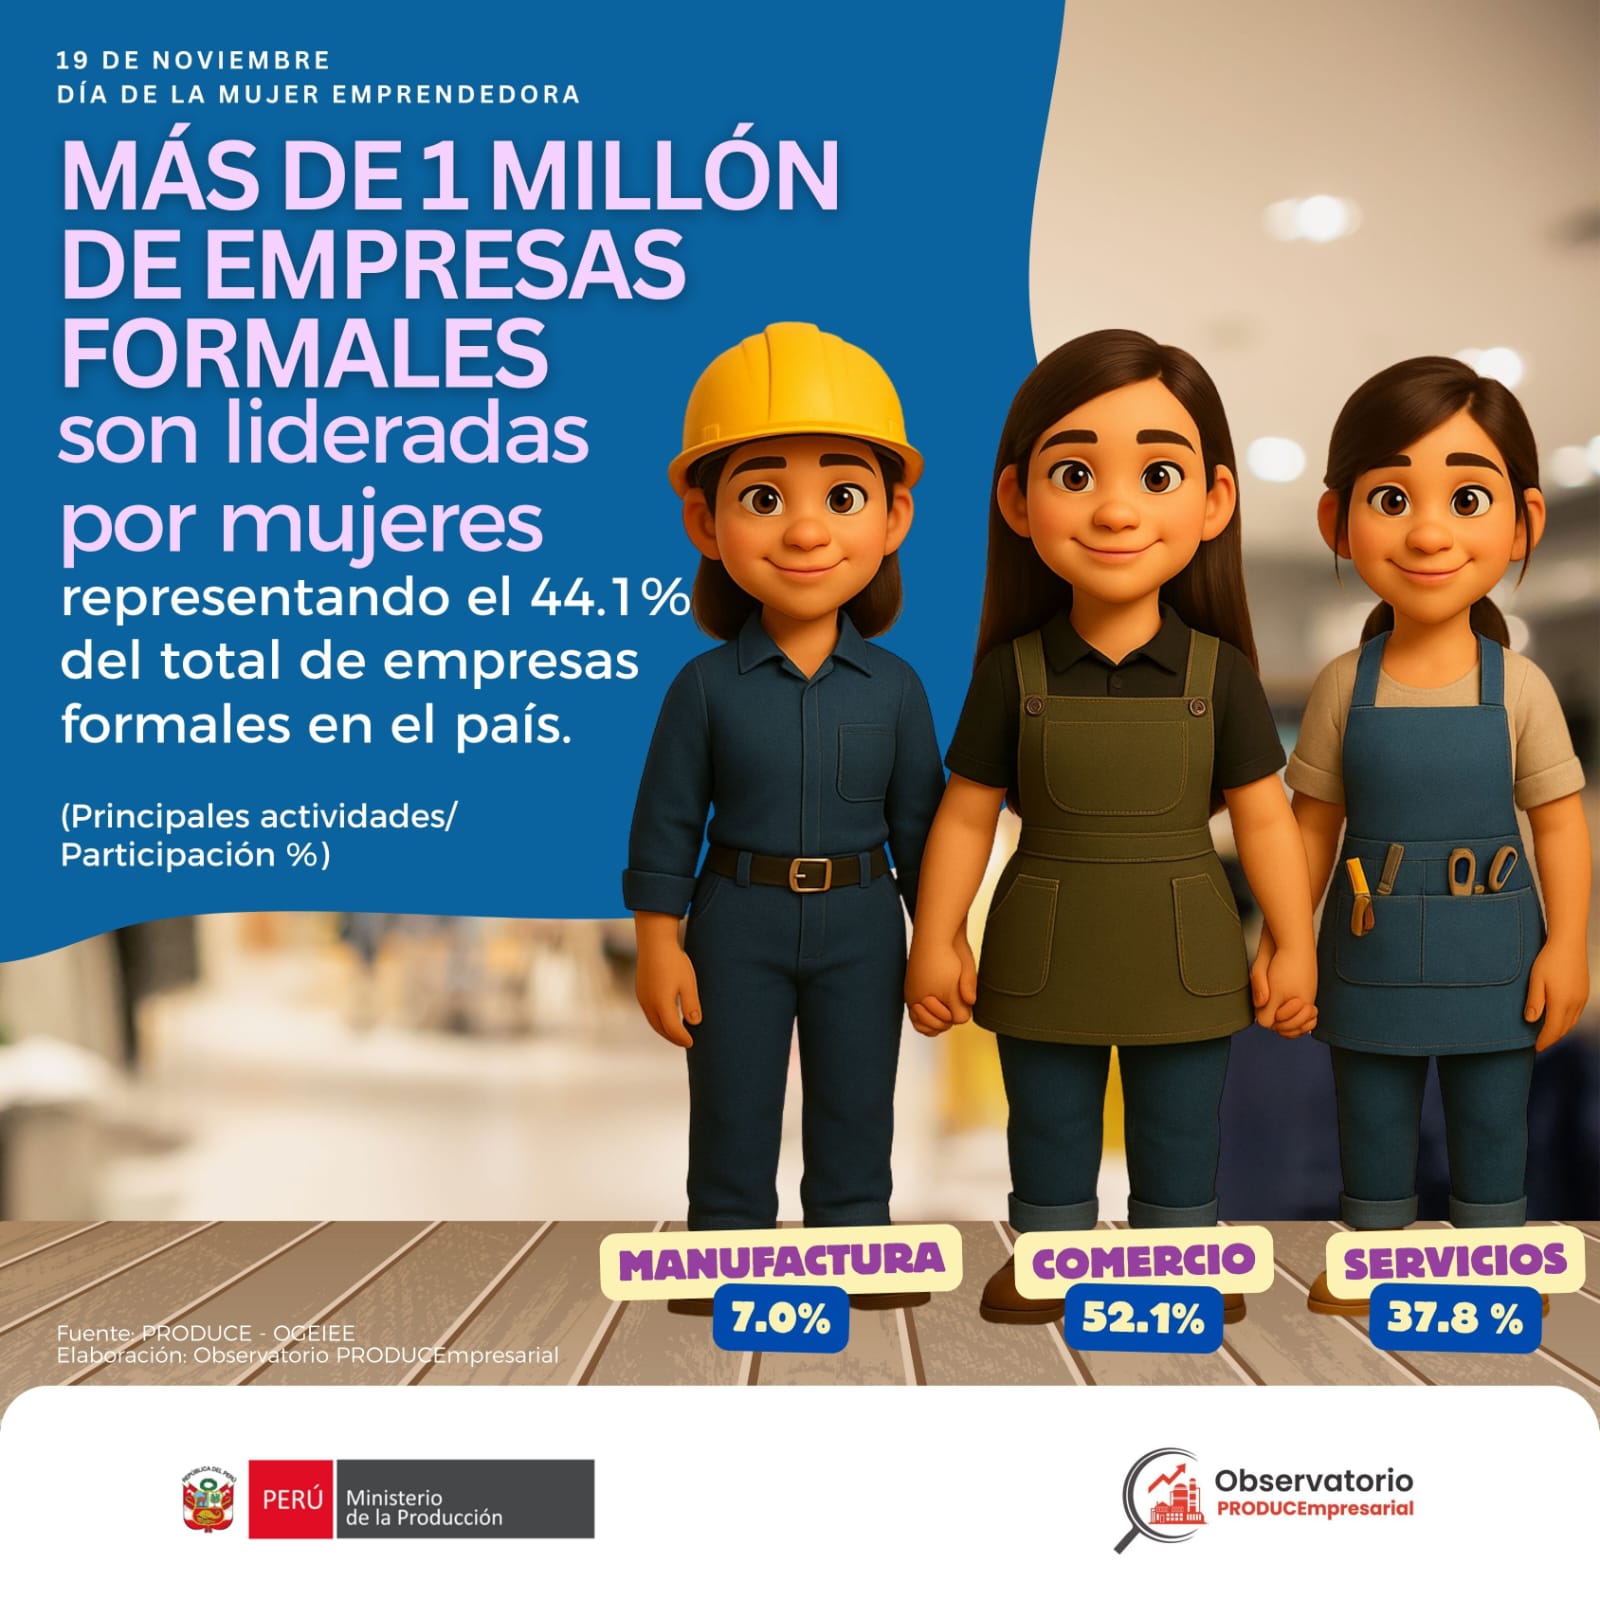
1 033 844
enterprises are led by women

99.5%
are MSE

52.1%
work in the retail sector
37.8%
They belong to the Services sector and 7% to Manufacturing


Download our databases

Download our surveys

Download our censuses
![]()
CONTACT US
Telephone:
(511) 616 2222
Annex: 3357
E-mail
producempresarial@produce.gob.pe