Manufacturing industry
noviembre 2025
In November, manufacturing GDP recorded a year-on-year decline of 2.1%. This result was mainly due to a contraction in primary manufacturing (−7.0%), associated with lower availability of raw materials. A slight decline in non-primary manufacturing (−0.1%) also contributed. In contrast, this negative performance was partially offset by growth in industrial exports (+1.8%).
01
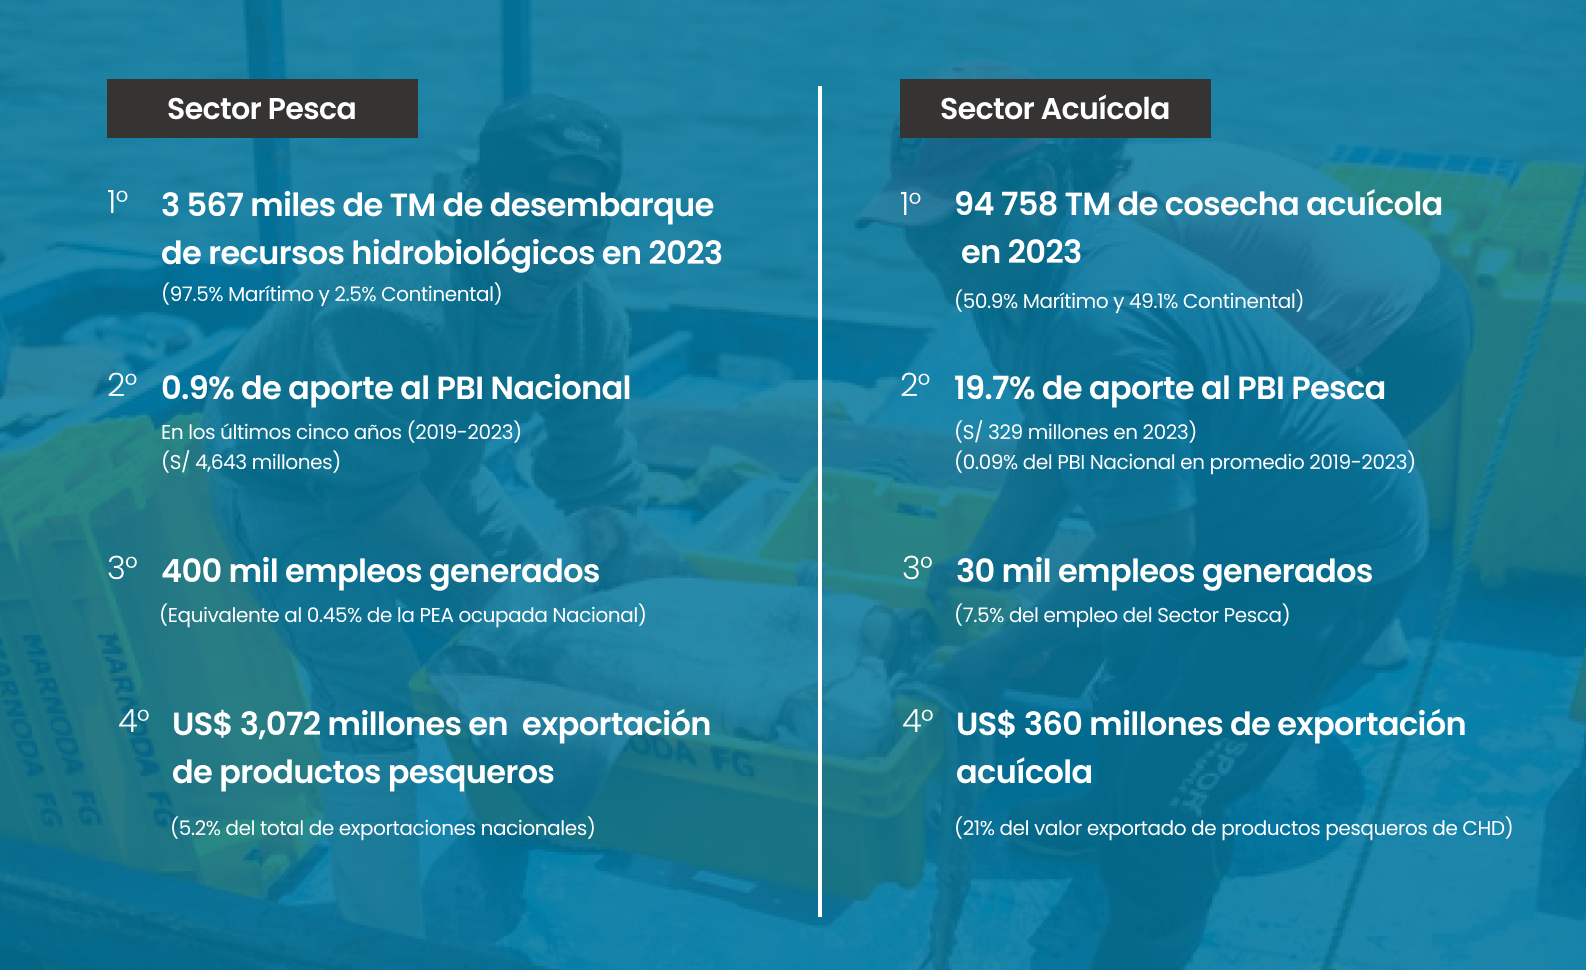
Fishing Sector
Noviembre 2025
En noviembre, el PBI del sector pesquero experimentó una caída de 17.8% respecto a similar mes del año anterior. Este resultado se explica
principalmente por una menor extracción de anchoveta para CHI.
02
Aquaculture
october 2025
In October 2025, aquaculture harvests reached 10,726 metric tons (MT), a year-on-year decrease of 24.0% compared to 14,091 MT. This result was mainly due to a reduction in the harvest of trout (−62.6%), tilapia (−31.8%), and scallops (−16.1%).
03
Domestic Trade
noviembre 2025
En noviembre, las ventas del comercio interno experimentaron un importante crecimiento de 9.4% interanual. Dicho avance estuvo asociado al aumento de las ventas en supermercados, tiendas por departamento y equipamiento para el hogar, impulsadas en parte por las estrategias comerciales asociadas a los Cyber days y la recuperación de la demanda interna.
04
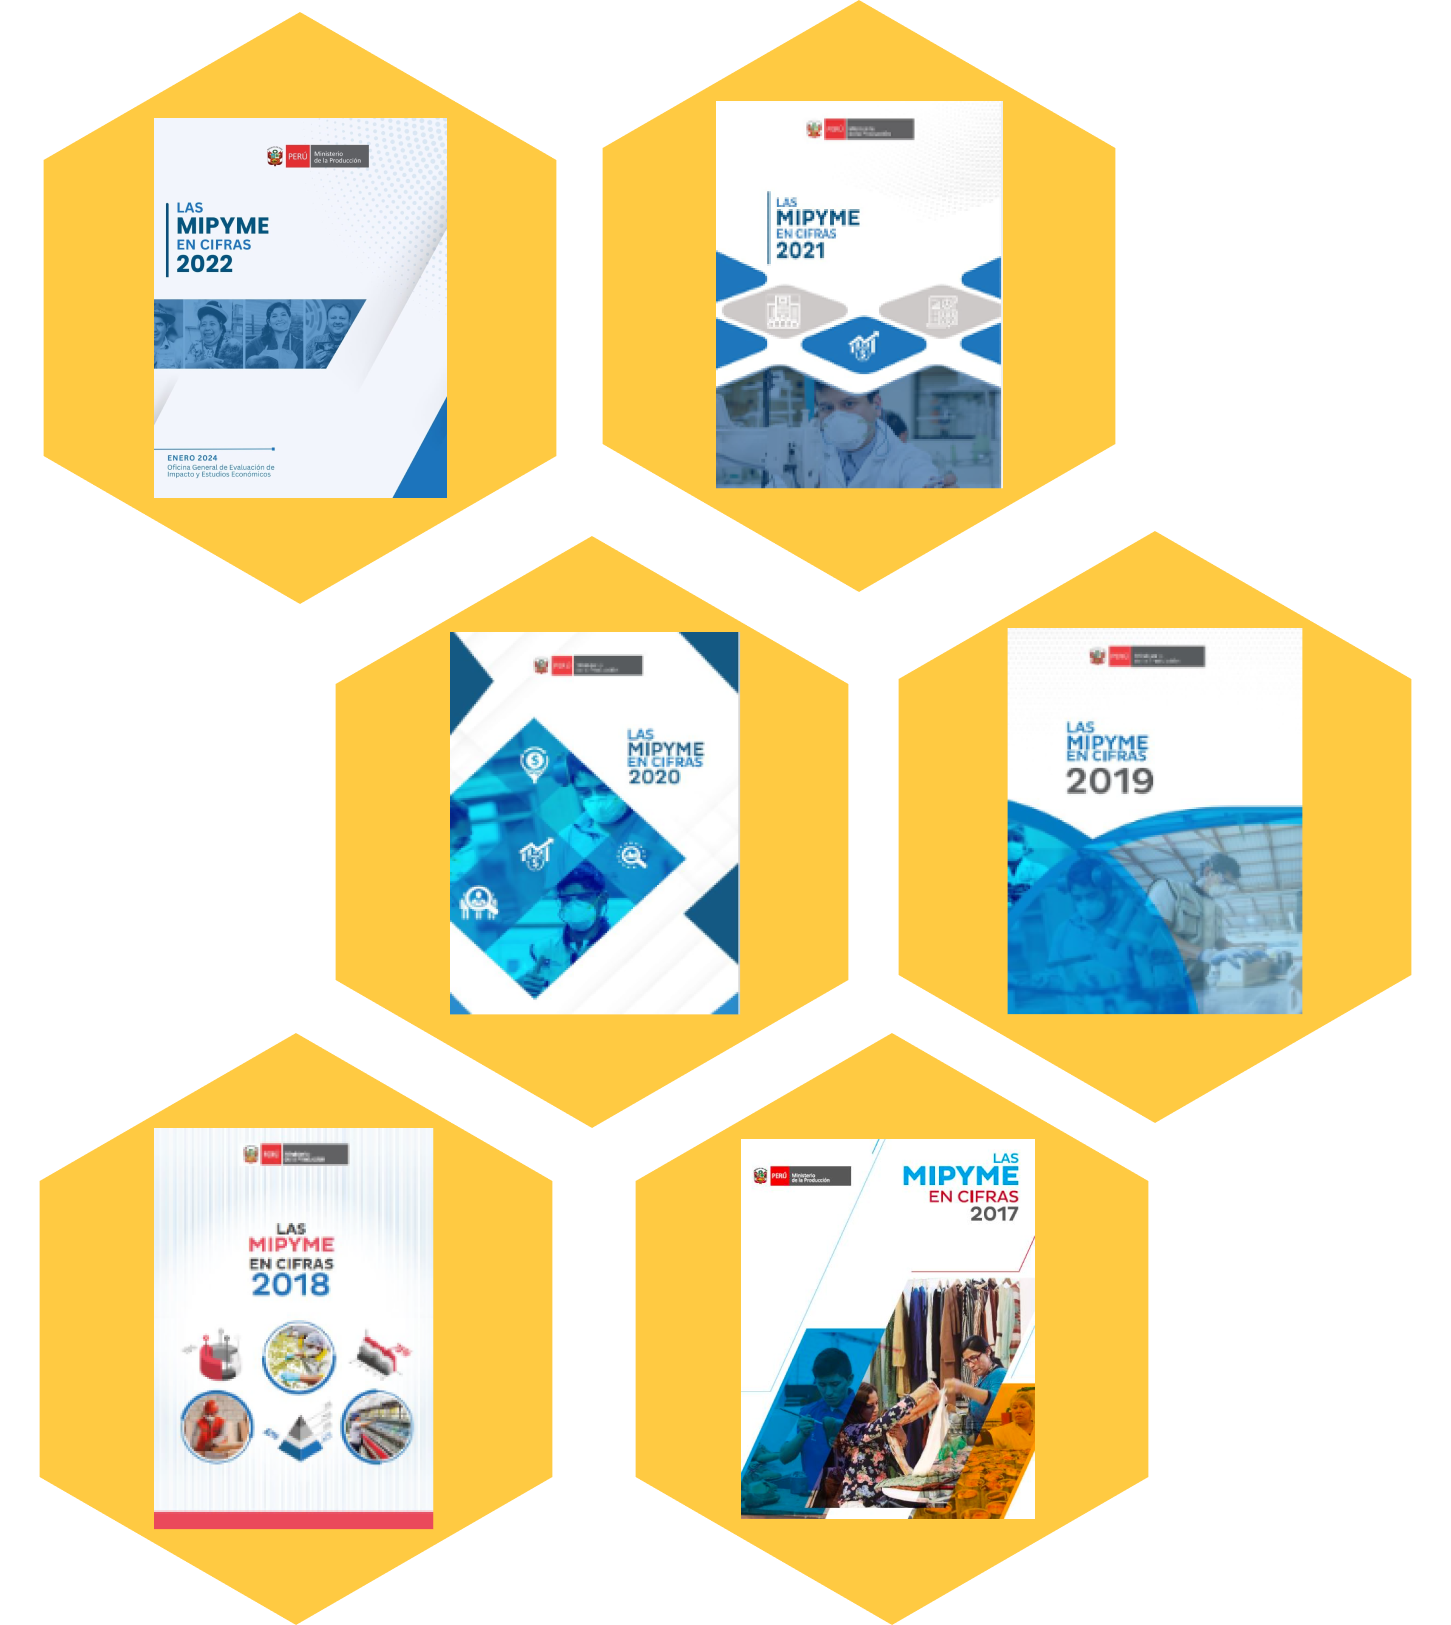
Sectoral Studies
These sectoral studies analyze the performance of an industry at an economic and statistical level, evaluating key indicators such as GDP, employment, and innovation. They are essential for strategic decision-making and the design of policies that promote sectoral growth. We invite you to review them!
05
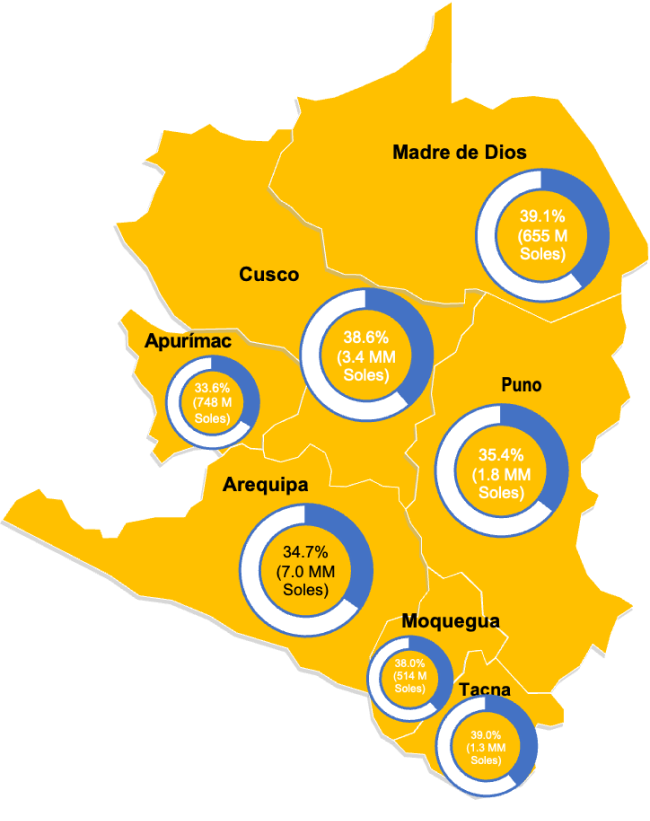
970 976
enterprises are led by women

99.6%
are MSE

53.3%
work in the retail sector
36.6%
are employed in the services sector; and 6.9%, in the manufacturing sector.


Download our databases

Download our surveys