Primary Metals
| Top | Company | % Share of Exports |
|---|---|---|
| 1 | NEXA RESOURCES CAJAMARQUILLA S.A. | 39.2% |
| 2 | PROCESADORA SUDAMERICANA S.R.L. | 18.1% |
| 3 | TECNOFIL S.A. | 13.5% |
| 4 | CORPORACION ACEROS AREQUIPA S.A. | 6.8% |
| 5 | INDUSTRIAS ELECTRO QUIMICAS S.A. | 5.6% |
Food and Beverages
| Top | Enterprises | % Share of Exports |
|---|---|---|
| 1 | TECNOLOGICA DE ALIMENTOS S.A. | 8.0% |
| 2 | PESQUERA EXALMAR S.A.A. | 5.7% |
| 3 | VIRU S.A. | 4.2% |
| 4 | VITAPRO S.A. | 3.9% |
| 5 | DANPER TRUJILLO S.A.C. | 3.7% |
Chemicals
| Top | Enterprises | % Share of Exports |
|---|---|---|
| 1 | QUIMPAC S.A. | 18.3% |
| 2 | SUCROALCOLERA DEL CHIRA S.A. | 6.7% |
| 3 | AGROAURORA S.A.C. | 6.2% |
| 4 | SUDAMERICANA DE FIBRAS S.A. | 5.9% |
| 5 | FAMESA EXPLOSIVOS S.A.C. | 4.9% |
Textiles
| Top | Enterprises | % Share of Exports |
|---|---|---|
| 1 | MICHELL Y CIA S.A. | 12.9% |
| 2 | TEXTILES CAMONES S.A. | 12.1% |
| 3 | TEXTIL DEL VALLE S.A. | 11.9% |
| 4 | HILANDERIA DE ALGODON PERUANO S.A. | 10.4% |
| 5 | INCA TOPS S.A. | 7.0% |
Rubber and Plastics
| Top | Enterprises | % Share of Exports |
|---|---|---|
| 1 | OPP FILM S.A. | 26.7% |
| 2 | PERUPLAST S.A. | 10.6% |
| 3 | COMPAÑIA GOODYEAR DEL PERU S.A. | 9.8% |
| 4 | SAN MIGUEL INDUSTRIAS PET S.A. | 8.7% |
| 5 | PERUANA DE MOLDEADOS S.A.C. | 3.3% |
Manufacturing industry
febrero 2026
In February 2026, manufacturing GDP recorded slight growth of 2.7% compared with February 2025. This performance was mainly driven by the moderate growth observed in non-primary manufacturing (3.6%); likewise, slight growth in primary manufacturing (+0.3%) also contributed.
01
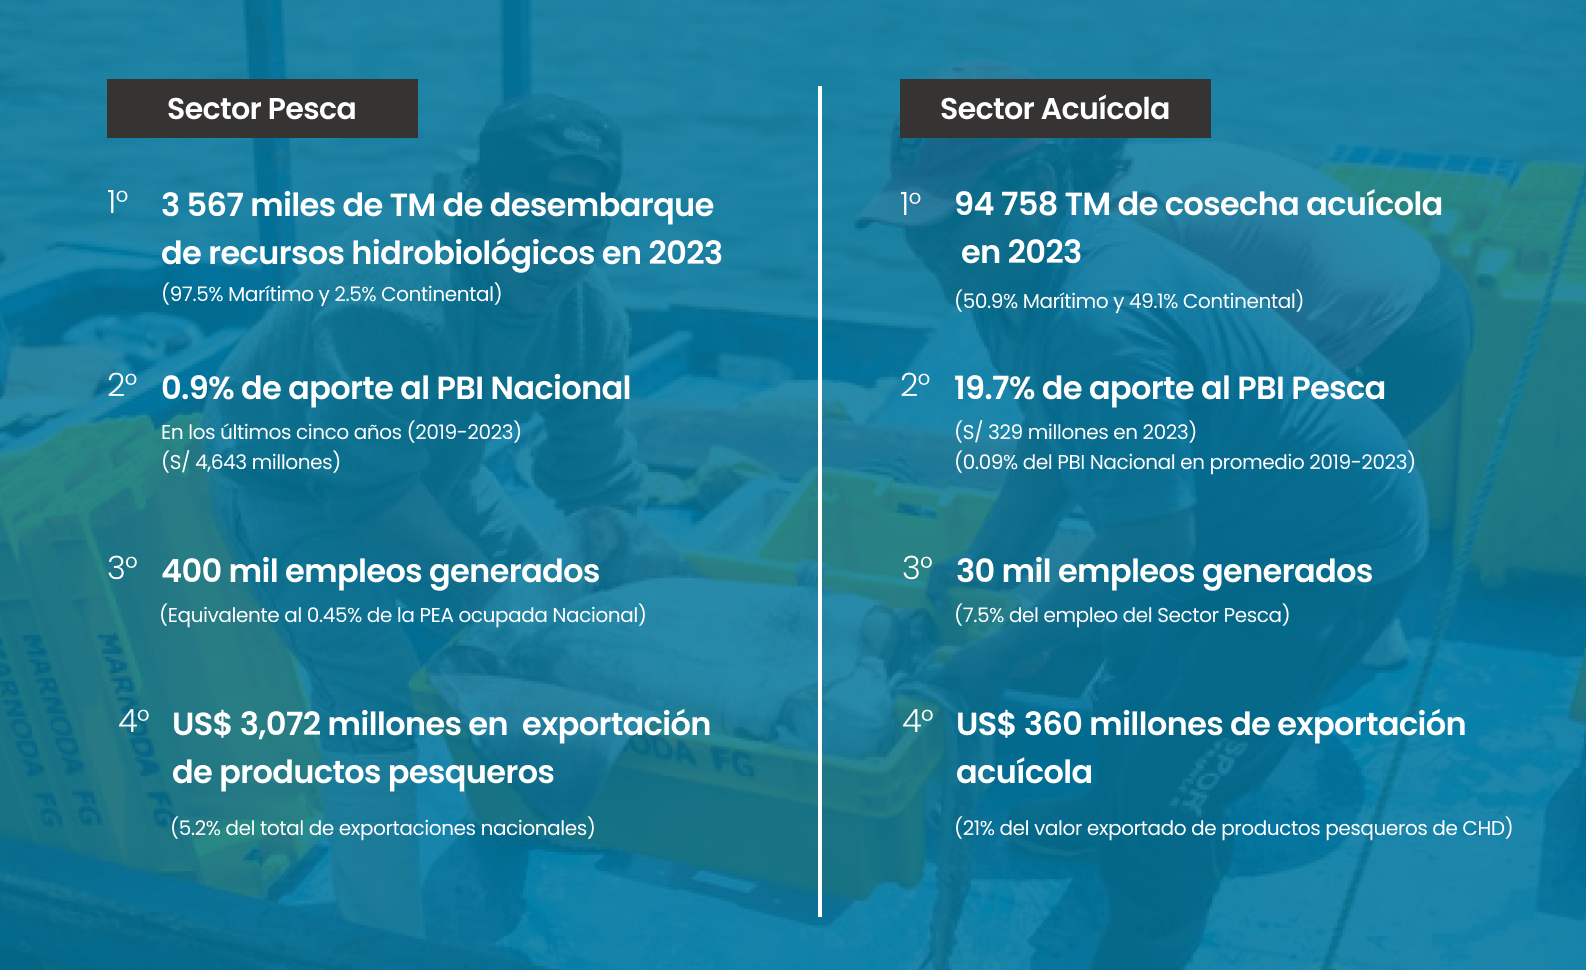
Fishing Sector
january 2026
In January 2026, the fishing sector’s GDP fell 9.6% year-on-year. This result is mainly explained by lower anchovy extraction for industrial fishmeal and fish oil production. In addition, landings totalled 430.4 thousand metric tons, representing a 29.8% decrease from January 2025 (613.2 thousand metric tons).
02
Aquaculture
january 2026
In January 2026, aquaculture harvests grew 49.5% year-on-year. This result was mainly driven by higher harvests of scallops (+106.8%), shrimp (+24.8%), trout (+11.1%), and tilapia (+31.2%), supported by improved weather conditions.
03
Domestic Trade
january 2026
En febrero del 2026, las ventas del sector comercio interno registraron un crecimiento significativo de (+13.7%) en comparación con febrero de 2025. Este desempeño fue impulsado por
la campaña del Día de San Valentín y la Amistad, en un contexto de mayor dinamismo de la demanda interna (6.5%).
04
Sectoral Studies
These sectoral studies analyze the performance of an industry at an economic and statistical level, evaluating key indicators such as GDP, employment, and innovation. They are essential for strategic decision-making and the design of policies that promote sectoral growth. We invite you to review them!
05
Current Information
Fishing Data
30% cayó el precio del Bonito
(4.5 soles x Kg). En 2023 récord histórico de captura de Bonito (116 815 toneladas)
Business Productivity
4.6% and 27.1% represent the productivity of micro and small enterprises compared to large enterprises, respectively.
Business Productivity
Total Factor Productivity has declined steadily over the last decade.
Business Informality
84.8% represents the level of labor informality in MSEs 91.3% asciende la Informalidad en las Microempresas a nivel nacional
Business Informality
Access the most comprehensive analysis of business informality in Peru.
Wholesale and Food Markets
2612 wholesale and food markets in Peru. 318 of them are located in rural areas.
Wholesale and Food Markets
Wholesale and Food markets are at the core of supplying essential products. Check their main characteristics based on the Wholesale Markets Census.
Convenience Stores
More than 590,000 convenience stores in the country. Lima accounts for 45% of the total.
Convenience Stores
Accede a información más relevante sobre el estado de las bodegas y además, ubica que te quede más cerca
Cooperatives
1245 Cooperatives are registered in Peru.
The cooperative membership population in the country totals 2.4 million individuals
Cooperatives
Up-to-date information on the world of cooperatives: discover who they are, where they are, what they do, and how many workers they employ.
01. MSMEs in Figures
Micro, small and medium-sized enterprises (MSMEs) represent 99.4% of the business sector in Peru. These firms are not only an integral part of the country’s business structure but also make a significant contribution to Gross Domestic Product (GDP), accounting for 21% a la riqueza nacional. Las Mipyme emplean el 61,4% of the Economically Active Population, underscoring their economic importance and positioning them as one of the country’s main drivers of employment.
03. Top Sectors of the Export Manufacturing Industry
| Top | Company | % Share of Exports |
|---|---|---|
| 1 | NEXA RESOURCES CAJAMARQUILLA S.A. | 39.2% |
| 2 | PROCESADORA SUDAMERICANA S.R.L. | 18.1% |
| 3 | TECNOFIL S.A. | 13.5% |
| 4 | CORPORACION ACEROS AREQUIPA S.A. | 6.8% |
| 5 | INDUSTRIAS ELECTRO QUIMICAS S.A. | 5.6% |
| Top | Enterprises | % Share of Exports |
|---|---|---|
| 1 | TECNOLOGICA DE ALIMENTOS S.A. | 8.0% |
| 2 | PESQUERA EXALMAR S.A.A. | 5.7% |
| 3 | VIRU S.A. | 4.2% |
| 4 | VITAPRO S.A. | 3.9% |
| 5 | DANPER TRUJILLO S.A.C. | 3.7% |
| Top | Enterprises | % Share of Exports |
|---|---|---|
| 1 | QUIMPAC S.A. | 18.3% |
| 2 | SUCROALCOLERA DEL CHIRA S.A. | 6.7% |
| 3 | AGROAURORA S.A.C. | 6.2% |
| 4 | SUDAMERICANA DE FIBRAS S.A. | 5.9% |
| 5 | FAMESA EXPLOSIVOS S.A.C. | 4.9% |
| Top | Enterprises | % Share of Exports |
|---|---|---|
| 1 | MICHELL Y CIA S.A. | 12.9% |
| 2 | TEXTILES CAMONES S.A. | 12.1% |
| 3 | TEXTIL DEL VALLE S.A. | 11.9% |
| 4 | HILANDERIA DE ALGODON PERUANO S.A. | 10.4% |
| 5 | INCA TOPS S.A. | 7.0% |
| Top | Enterprises | % Share of Exports |
|---|---|---|
| 1 | OPP FILM S.A. | 26.7% |
| 2 | PERUPLAST S.A. | 10.6% |
| 3 | COMPAÑIA GOODYEAR DEL PERU S.A. | 9.8% |
| 4 | SAN MIGUEL INDUSTRIAS PET S.A. | 8.7% |
| 5 | PERUANA DE MOLDEADOS S.A.C. | 3.3% |
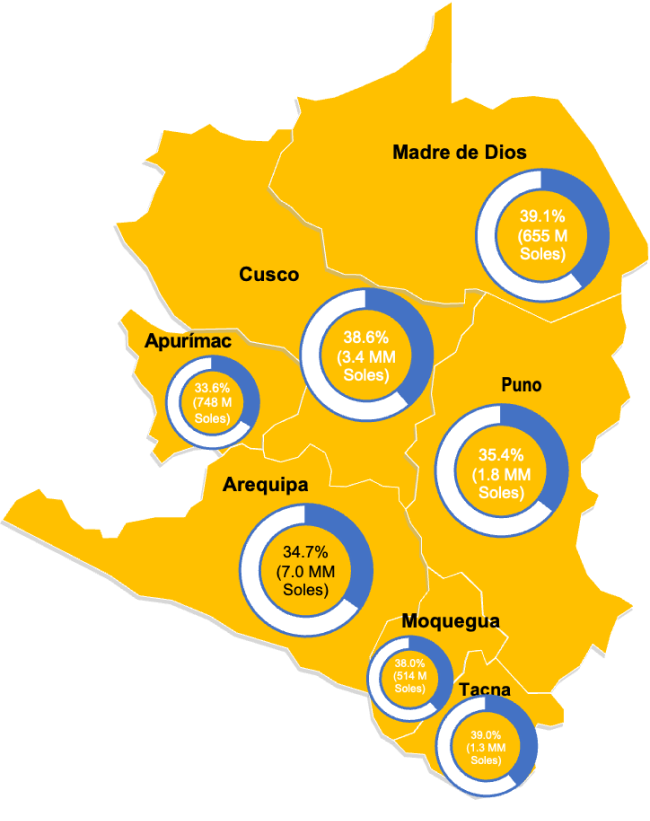
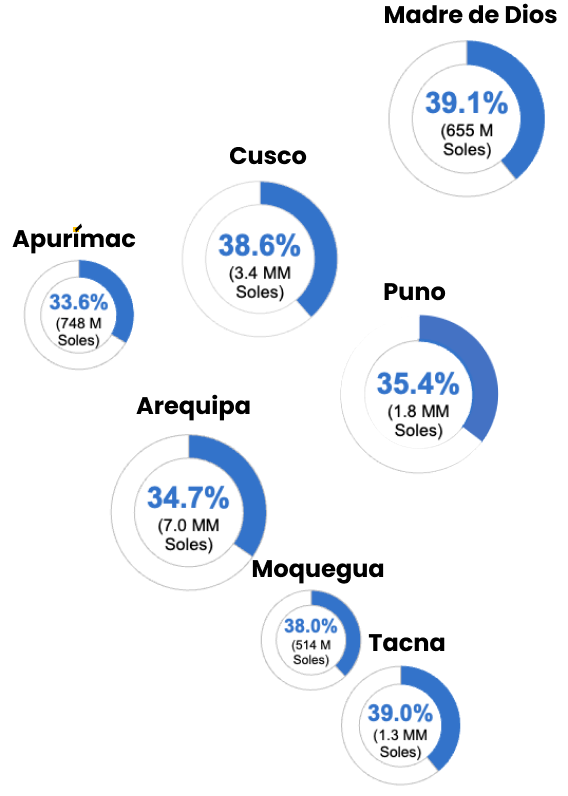
04. Access to Financing
05. The Role of Women Entrepreneurs
970 976
Companies are led by women

99.6%
Are MSEs
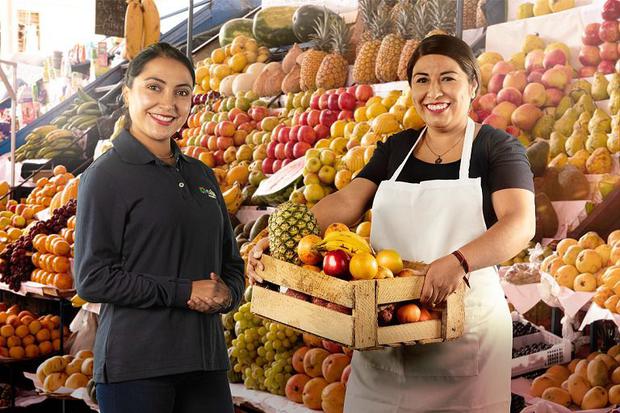
53.3%
work in the retail sector
36.6%
are employed in the services sector; and 6.9%, in the manufacturing sector.
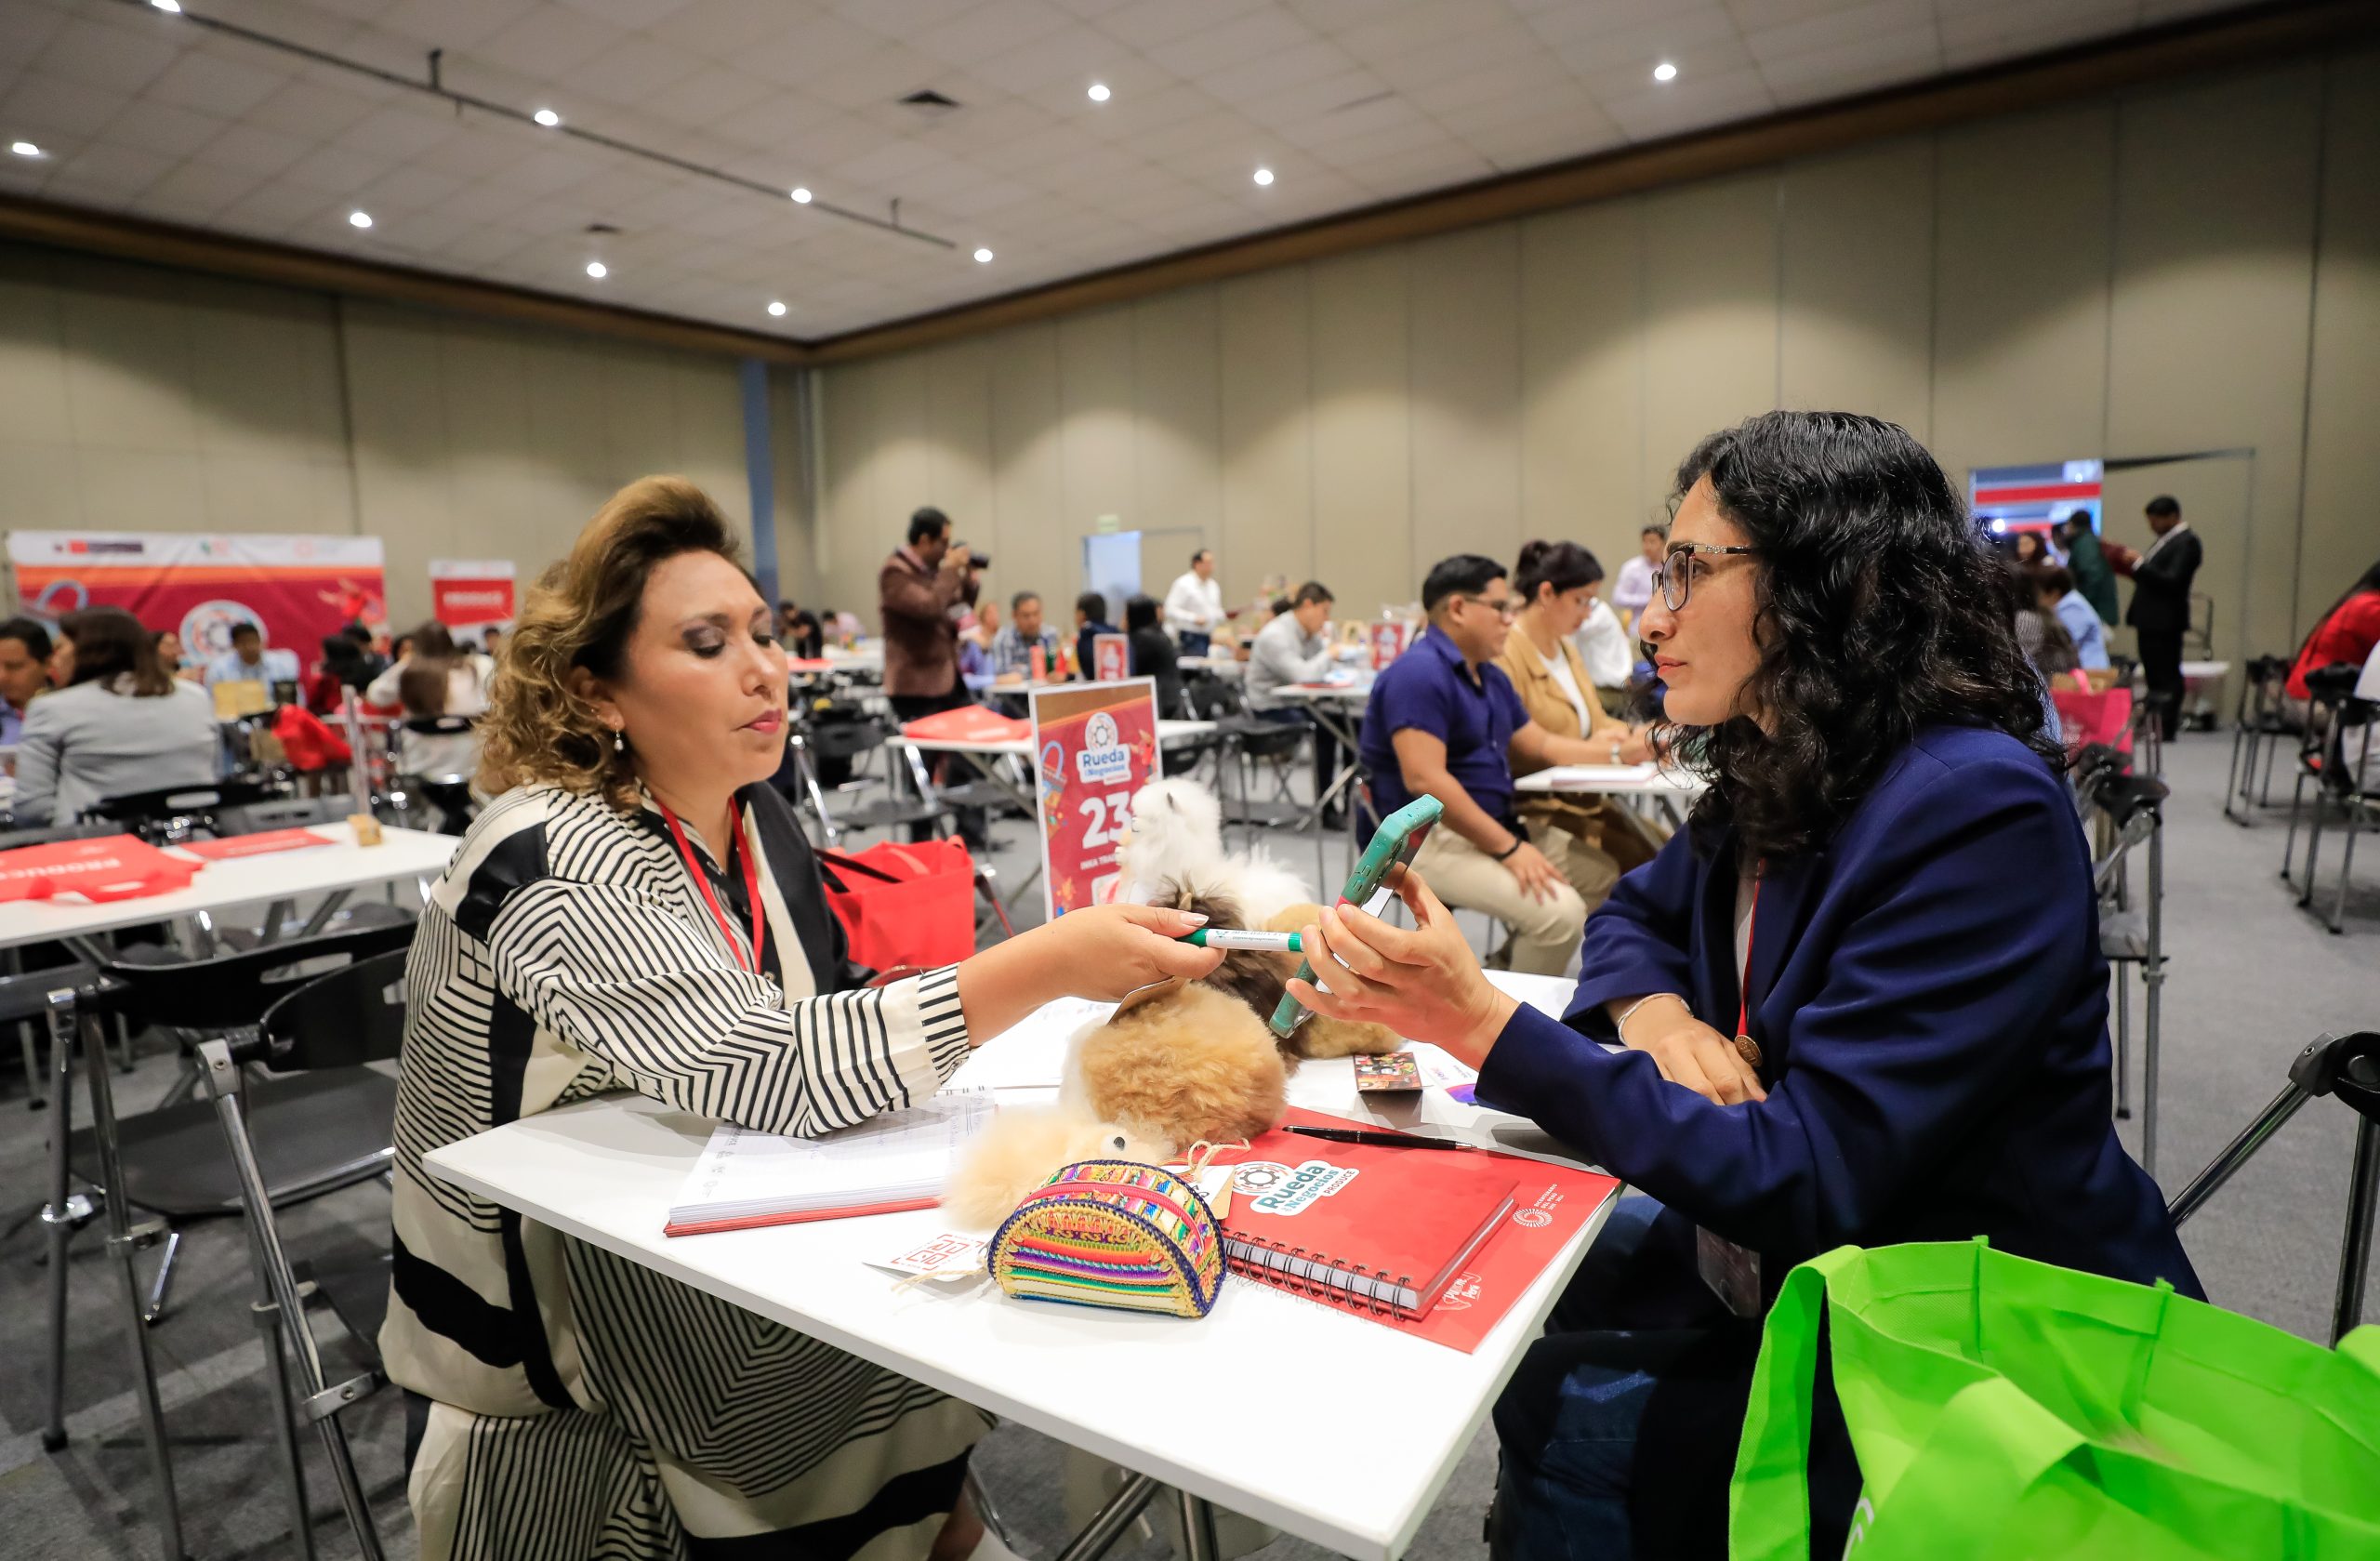
Between 2018 and 2022, the participation of women as managers of formal enterprises exceeded 40.0% of the total.
During this period, the number of female entrepreneurs exhibited an average annual growth of 1.7%, peaking in in 2019 with 2.39 million women entrepreneurs. However, there was a significant decline in 2020, with a decrease of 37.6% due to the impact of the pandemic